New Jersey Future Blog
Built-Out Places Account for Majority of State’s Population Growth Since 2008
May 20th, 2016 by Tim Evans
Population losses now widespread across the state’s exurban fringe, rural areas

New housing near a Hudson-Bergen Light Rail station in Jersey City. Photo courtesy of NJTPA.
New Jersey Future’s initial analysis of newly released Census data at the municipal level shows the continuation of several important demographic trends in the state. A preliminary look at the data provided the following highlights:
- Redevelopment is increasingly the new normal. Population growth in places that were already at least 90 percent built-out as of 2007 is now substantially outstripping growth in the rest of the state. These built-out places have grown by 3.5 percent from 2008 to 2015, as opposed to just 2.8 percent statewide.
- Places that are at least 90 percent built-out accounted for a full two-thirds of statewide population growth (66.4 percent) from 2008 to 2015, after having accounted for only 3.6 percent of statewide growth from 2000 to 2008.
- Population losses are now widespread across the exurban fringe and rural areas:
- 20 out of 22 municipalities in Warren County have fewer people in 2015 than they had in 2008.
- The same is true of 23 out of 24 municipalities in Sussex County.
- The same is true of 22 out of 26 municipalities in Hunterdon County.
- In the rural southern end of the state, 2015 populations are smaller than 2008 populations in 14 out of 16 municipalities in Cape May County, 9 out of 14 municipalities in Cumberland County, and 11 out of 15 municipalities in Salem County.
- The most consistent population gains are happening in the five “urban core” counties closest to New York City — Hudson, Bergen, Passaic, Essex, and Union. Every municipality in all of these five counties except for Irvington has more people as of 2015 than it did in 2008 (and even Irvington is down by only 21 people since 2008). And among the five counties, single-year population losses from 2014 to 2015 are also relatively rare — losses have occurred in only five municipalities in Hudson, only two in Passaic, only one each in Bergen and Essex, and none in Union.
- Walkable urbanism is also the new normal. From 2008 to 2015, the 118 municipalities that scored well on all three of the main smart-growth metrics that were created for New Jersey Future’s Places to Age project — net activity density, presence of a center, and local street network density — have grown by 4.4 percent, compared to only 2.8 percent for the state as a whole. This is a turnaround from the earlier part of the 2000s, when the high-scoring smart-growth places grew by only 0.5 percent from 2000 to 2008, compared to 3.5 percent for the whole state and 6.4 percent for the 181 municipalities that didn’t score well on any of the three metrics. Those 181 low-scoring municipalities experienced a turnaround in the other direction, growing by only 2.0 percent from 2008 to 2015 — less than half the growth rate of the high-scorers. What’s more, the poor-scoring municipalities remained flat over the last year (0.0 percent change) while the 118 high-scoring municipalities grew by 0.4 percent.
- The smaller more-urban counties of Camden and Mercer fall somewhere in between. Camden and Trenton both lost population over the last year and for the entire 2008-2015 period, while their suburbs split about evenly between population gainers and population losers, both for the last year and the whole post-2008 period more generally.
- Looking just at the annual change from 2014 to 2015, rural, exurban, and even some maturing suburban areas fare even worse. In addition to the six counties mentioned above,year-to-year losses are now seen throughout Somerset, Monmouth, Burlington, Gloucester, and Atlantic counties, with more than half the municipalities in each of those counties losing people over the last year.
- At the macro level, the slowing down of growth on the exurban fringe can be seen most dramatically in the fact that, taken as a group, municipalities that were less than 50 percent built-out as of 2007 actually experienced a small loss of population (-0.3 percent) from 2014 to 2015. On the other hand, the 90-percent-built-out places grew by 0.3 percent, faster than the overall statewide rate of 0.2 percent. For context, the municipalities that are less than 50 percent built-out grew by 10.7 percent from 2000 to 2008 (vs 3.5 percent statewide growth over the same period) and grew by 10.1 percent in the 1990s (compared to 8.6 percent for the state as a whole).
See NJ Spotlight’s interactive map showing population gains and losses by municipality.
Related Posts
 December 12, 2014 New Jersey Lags Behind in Some Key Real Estate Trends
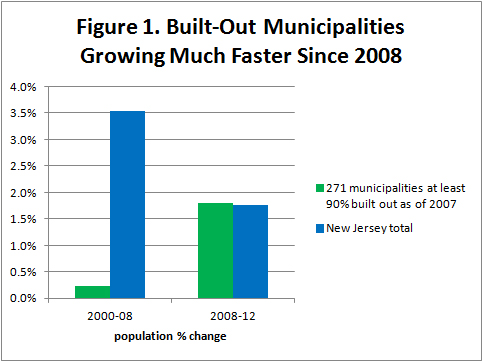 January 28, 2014 Is Redevelopment the ‘New Normal?’
 July 19, 2011 New Jersey Cities Breathe Sigh of Relief
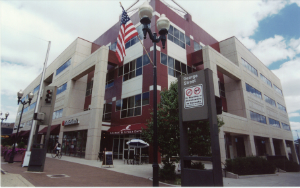 January 4, 2012 Demand Grows for Smart-Growth Work Environments
 October 8, 2009 Where and How is New Jersey Growing?


