New Jersey Future Blog
Opportunity Zones Take Another Step Forward
April 10th, 2018 by Tim Evans
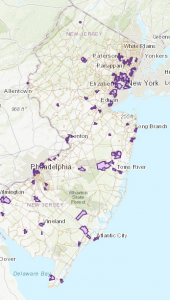
New Jersey’s Opportunity Zones. Click to be taken to the Department of Community Affairs’ interactive map.
On March 10, Gov. Phil Murphy submitted to the U.S. Treasury a list of 169 Census tracts in New Jersey that were being nominated for inclusion in the new Opportunity Zone program. On April 9, the Treasury Department released the full list of approved Census tracts, including all 169 in New Jersey. The full list and an interactive map of these tracts is available on the website of the state Department of Community Affairs.
The Opportunity Zone program was created as part of the recently passed federal Tax Cuts and Jobs Act, and provides a vehicle for private capital investment in “distressed areas.” The program was first proposed in 2015 by the Economic Innovation Group, and was co-sponsored by New Jersey Sen. Cory Booker.
While the federal government established the universe of eligible distressed Census tracts, it was up to each state to narrow the list to 25 percent or less of the eligible tracts. The art of picking the final tracts lies in identifying places where the state would like to direct growth and that have some market potential to attract the kind of private investments that will help these communities become less distressed over time.
There are many variables that can be used to look at market strength, from an inventory of assets to economic indicator trends. New Jersey Future looked at three indicators – population change, change in median rent, and change in median household income – for all 2,010 Census tracts in New Jersey, to see how the 169 selected Opportunity Zone tracts compare to the rest of the state. These three variables were analyzed at the tract level, using five-year American Community Survey data from 2016 (the most recent available) and 2011, for a five-year trend.
Population growth
Population growth in the Opportunity Zone tracts is slightly outpacing the statewide population growth rate. Statewide, the population grew by 1.9 percent from 2011 to 2016, but the 169 Opportunity Zone tracts collectively grew by 4.4 percent. This overall total is partly influenced by extraordinarily fast growth of a small number of tracts: 22 of the Opportunity Zone tracts grew by 20 percent or more in the five-year period. But it is not just this handful of places that is dragging the average up – the median growth rate over all 169 Opportunity Zone tracts was 2.2 percent, still higher than the statewide growth rate. Eighty-seven of the OZ tracts grew faster than the statewide rate; of those that grew more slowly than the statewide rate, 71 actually lost population (these 71 constitute 42 percent of all Opportunity Zone tracts). The Opportunity Zone tracts were not any more likely to lose population than elsewhere, however; of all 2,001 inhabited tracts in the state, 878 lost population between 2011 and 2016 – 43.9 percent of all tracts, nearly identical to the share of Opportunity Zone tracts that lost population.
Change in median rent
The Opportunity Zone tracts somewhat lagged the statewide growth rate in median rent. At the state level, median rent increased 7.3 percent, from $1,131 in 2011 to $1,213 in 2016. But among the 169 Opportunity Zone tracts, the median rate of increase in median rent was 6.1 percent.
Among all 169 Opportunity Zone tracts, there were 91 whose increase in median rent fell short of the statewide increase; this count includes 46 tracts where median rents actually fell. Again, however, a decrease in median rent was no more likely among the Opportunity Zone tracts than it was elsewhere. Of the 1,601 non-Opportunity Zone tracts for which data on median rent were available for both years, 443 saw their median rents decrease – 27.7 percent of such tracts, nearly identical to the 27.2 percent of Opportunity Zone tracts that saw decreases.
Change in median household income
Statewide, median household income increased 3.5 percent, from $71,180 in 2011 to $73,702 in 2016. The majority – 100 – of the Opportunity Zone tracts had changes in median household income that fell short of this rate, including 88, or slightly more than half, that actually saw their median household incomes decrease. (In contrast, only 39.4 percent of the 1,819 non-Opportunity Zone tracts for which data were available posted declines in median household income.) The median change over all Opportunity Zone tracts was a small loss of -1.0 percent.
However, looking just at the subset of 83 Opportunity Zone tracts that were also flagged as distressed by the Low Income Housing Tax Credit Program in 2015, the median rate of change was an increase of 6.8 percent. So among the 169 tracts that were selected as Opportunity Zones, the ones that were in the most need of help are actually the ones showing the greatest recent improvement, relative to where they started.
Transit Stations
A healthy majority – 108 out of 169 – of the tracts selected as Opportunity Zones are within half a mile of one of the state’s 244 transit stations (including major bus terminals). Transit proximity offers access to a larger number of jobs, and has recently regained importance as a driver of population growth, as New Jersey Future has highlighted.
Smart Growth Measures
An even more substantial majority of the Opportunity Zone tracts – 127 out of 169 – are located in municipalities that score well on all three of New Jersey Future’s metrics of compactness and walkability: population and employment density, presence of a mixed-use downtown, and local street network density. And even among the exceptions, many are located in parts of their host municipalities that possess the raw materials – assets like transit proximity and an existing grid street network with sidewalks – for becoming more “center”-like, and hence may show a quick return on investment. Being located in a walkable, mixed-use neighborhood is a promising indicator, given that much of the state’s recent population growth has been happening in such places, thanks in large part to the pronounced preference of the Millennial generation for a “live-work-play” environment.
Next Steps
The next step in the implementation process is for the Treasury Department to promulgate regulations for the establishment of Opportunity Funds, the vehicles via which Opportunity Zone investments will be made. It will be important for these regulations not to preclude local expertise, which can help ensure that investments are made in ways that will both provide a return to investors and ensure that community goals are met. New Jersey Future will stay engaged in this process, including looking at ways that these funds can include policy guidance and be flexible enough to accommodate the different needs and conditions of each of the Opportunity Zone communities.
For state and local leaders charged with implementing this program, this piece from the Economic Innovation Group provides sound guidance on next steps.
Related Posts
 November 27, 2017 Smart-Growth Policy Priorities Well Represented on Murphy Transition Team
 September 28, 2017 Analysis: New Jersey Is Losing Its Millennials
 September 19, 2017 Gubernatorial Candidates on Key Issues Facing New Jersey
 May 23, 2017 Report: Changes in Affordable Housing Tax Credit Criteria Move More People to High-Opportunity Areas
 March 10, 2017 Recommendations for the Next Governor


