New Jersey Future Blog
Where are the lead service lines in New Jersey?
October 3rd, 2019 by Gary Brune
New Jersey, along with states across the country, is confronting a public health threat: lead in drinking water. The primary source is lead service lines (LSLs), hose-sized pipes containing some amount of lead that connect water mains under the streets to buildings. But which communities are most at risk?
As of August, 2019, lead service lines have been found in 104 water systems, potentially exposing some portion of over 5 million residents who live in these service areas. Lead may also be present in pipes and plumbing in older homes, schools and other buildings. Some water utilities treat drinking water with corrosion control chemicals to minimize the leaching of lead from pipes and plumbing.
New Jersey Future mapped data that the New Jersey Department of Environmental Protection (DEP) collected from community water systems to show the intensity of LSLs across the state. Most LSLs were installed before 1940, so older communities are more likely to have higher concentrations of the pipes.
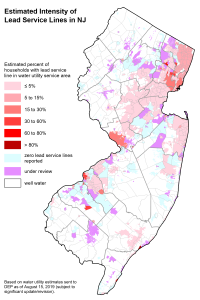
If the map indicates the presence of LSLs in your community, you can contact your water utility to request more detailed information on water test results, and if available, the location of lead service lines. Your water utility can tell you if protective actions, such as installing an in-home filter or flushing your pipes, are recommended. You can also speak with them about how to determine if you have a lead service line and/or lead in indoor plumbing or fixtures. Community results are also available on DEP’s Drinking Water Watch website.
The information in DEP’s LSL inventory is dynamic, as inventory records are often updated based on ongoing field operations. The data used for this map was current as of August 15, 2019 and was gathered from the utilities’ lead and copper sampling plans and a survey issued by DEP. Some of the 104 water systems with LSLs provided verified locations of the pipes while others provided estimates based on records. Many systems that reported the presence of LSLs will likely find more, as there are another 150 water systems that either are not in a position to make an estimate or have submitted an inventory that has not yet been evaluated by DEP. Part of the LSLs are typically under the authority of the utility (the portion from the street to the curb) while the other portion is located on private property. The number of LSLs located beneath private property may be significantly underreported in the survey results to date. As a point of reference, the American Water Works Association estimates there are 350,000 LSLs in New Jersey, while DEP’s survey to date captures only 161,000.
A task force convened by Jersey Water Works, a collaborative of diverse organizations focused on transforming New Jersey’s inadequate water infrastructure and of which New Jersey Future is a member, will soon be releasing a report of recommendations for the state to virtually eliminate lead in drinking water in 10 years.
Explanation of Map Legend
Estimated Percent of Households with Lead Service Lines in Water Utility Service Area
Different intensities of LSL concentrations appear as different shades of red and pink on the map. They were calculated by dividing the known or estimated number of LSLs in the water utility service area by the estimated number of households. The estimated number of households was used instead of the total number of properties because LSLs are rarely found at commercial properties, though it is possible that some of the LSLs on this map serve small commercial buildings.
Zero Lead Service Lines Reported
329 water systems reported no lead service lines. (Those areas appear as blue space on the map.)
Under Review
This map segment reflects the 150 water systems that either are not in a position to make an estimate (i.e., often due to poor or incomplete inventory records) or that submitted an inventory that has not yet been evaluated by DEP. (Those areas are colored purple on the map.)
Well Water
Approximately 10% of the state population is served by private well water, which is not part of any water system reporting. (Those areas are colored white on the map.)
Methodology Used to Prepare the “Estimated Intensity of Lead Service Lines in NJ”
The estimated percent of housing units in a water service area having lead service lines is the ratio of the estimated number of LSLs in that water service area (from DEP) to the total number of housing units in the water service area. Counts of total housing units are available at the census tract level from the U.S. Census Bureau’s American Community Survey.
Earlier analysis by researchers at Rutgers University produced estimated population counts for water utility service areas. The counts were produced for GIS polygons by intersecting the GIS layers for census tracts, water service areas, and sewer service areas, allowing for the creation of a factor that indicates the population of a given GIS intersection polygon as a percent of the total population of its host census tract. Total housing unit counts for water service areas are constructed by summing the estimated housing unit counts for all GIS polygons contained in the water service area. The polygon estimates were then constructed using housing unit counts at the census tract level from the American Community Survey.
The table with estimated percent of housing units having a lead service line per water utility was joined in a GIS layer with water utility boundaries based on a unique identifier present in both tables. The map of lead service line estimates per utility was manually classified into 6 interval classes based on natural breaks in the data distribution. Water utility boundaries show GIS data as of 2017 for public community water purveyor service areas, as acquired from the DEP Open Data website on August 20, 2019.
Related Posts
 October 8, 2004 Concentrating Poverty
 October 27, 2015 Are Towns in a Better Position to Make Long-Term Resiliency Decisions?
 August 11, 2011 Blackouts and a Bright Spot in the Energy Master Plan
 March 11, 2020 Smart Growth Gets Smarter
 June 15, 2021 All Boats Rise: Investing in Climate Resilience & Communities


