Browse All Resources
School District Fragmentation and Residential Segregation
11/09/2020


If New Jersey wants to address its status as one of the most segregated states in the country, mitigating its exclusionary land-use incentives by organizing and funding public education at a higher level of government might be a good place to start.
The level of government at which basic public services like police and fire protection or trash collection are provided, and at which public schools are operated and funded, varies widely from one part of the country to another. States in the Northeast (and the Great Lakes and the Great Plains) tend to be entirely partitioned into functioning sub-county governments, known alternatively as municipalities, county subdivisions, or minor civil divisions (MCDs). It is municipal government that provides basic government services to most residents in these states, and school districts are usually also run by individual municipalities or by groups of municipalities. In the South, sub-county governmental units are far less pervasive, with county government serving as the nearest level of “local” government for many people and with school districts often operated at the county level. (The West is more of a mixed bag.)
Generally speaking, the lower the level of government at which schools are operated, the smaller each district will be (in terms of population served), and the greater will be the number of districts for a given population. New Jersey’s public school landscape is particularly fragmented—it averages 28 school districts per county, the most of any state, and averages just under 15,000 residents per school district, well below the national average of 23,344. New Jersey Future has written about how New Jersey’s fragmented collage of public school districts leads to land-use incentives that discourage residential development. Briefly: 1) New Jersey (like many of its Northeastern neighbors) relies on property taxes for funding local services, especially schools; 2) residential properties usually generate more in school costs than they pay in taxes, while commercial and industrial properties are fiscal winners; 3) New Jersey’s numerous and geographically small school districts ensure that there are not enough malls and office buildings to go around, leading to acute competition for a limited supply. (This scramble to attract non-residential property-tax revenue generators is often referred to as the “ratables chase.”) The result is a system in which every jurisdiction has an incentive to court hotels, office parks, and shopping centers to pad its budget while discouraging the construction of new housing that might attract school children and necessitate property-tax increases.
New Jersey’s fragmented collage of public school districts leads to land-use incentives that discourage residential development, and it may also contribute to residential segregation, both by income and by race.
We are interested in exploring whether this school district fragmentation and the lack of housing options it engenders may also contribute to residential segregation, both by income and by race. We will compare New Jersey’s 21 counties with a set of counties in nearby states (including some that are major destinations for New Jersey out-migrants) where the provision of public education is organized differently, to see if the degree of fragmentation appears to be related to the degree to which certain disadvantaged groups (lower-income, Black, and Hispanic populations) tend to be concentrated in relatively few neighborhoods. Specifically, we will measure segregation by looking at the percentage of people living in poverty who live in high-poverty neighborhoods, the percentage of Black residents who live in majority-Black neighborhoods, and the percentage of Hispanic residents who live in majority-Hispanic neighborhoods. We will use census tracts to represent the concept of a neighborhood.
In addition to New Jersey’s 21 counties, we will look at the following counties (and one state) in states that are nearby, demographically similar to New Jersey, and/or major attractors of New Jersey out-migrants:
- Hawaii, which is unique among the 50 states in having only one school district, serving the entire state and funded at the state level, and therefore makes an interesting comparison case.
- In Maryland, the large suburban counties of Montgomery, Prince George’s, Anne Arundel, and Baltimore County (which is distinct from the city of Baltimore), where schools are run at the county level.
- In Virginia, the large suburban counties of Fairfax, Prince William, Henrico, and Chesterfield (the first two being suburban to Washington, DC, and the latter two being suburban Richmond); again, schools in Virginia are run at the county level.
- In North Carolina, the counties of Mecklenburg (which contains Charlotte) and Wake (which contains Raleigh), the counties that attract the largest numbers of migrants from New Jersey to North Carolina; as in Maryland and Virginia, schools in North Carolina are run at the county level, even in counties that contain large cities.
- In Delaware, New Castle County (which contains Wilmington), which has sub-county school districts like New Jersey, Pennsylvania, and New York, but which, unlike its northern neighbors, is not entirely partitioned into municipal governments; Delaware thus serves as something of a hybrid model between the county-run districts to its south and the municipally-run districts to its north.
- In Pennsylvania, the suburban Philadelphia counties of Bucks, Chester, Delaware, and Montgomery, where school systems are organized at the municipal level but where districts shared by multiple municipalities are much more common than in New Jersey.
- In New York, Rockland and Orange counties, which are just on the other side of New Jersey’s northern border and which are similarly fragmented.
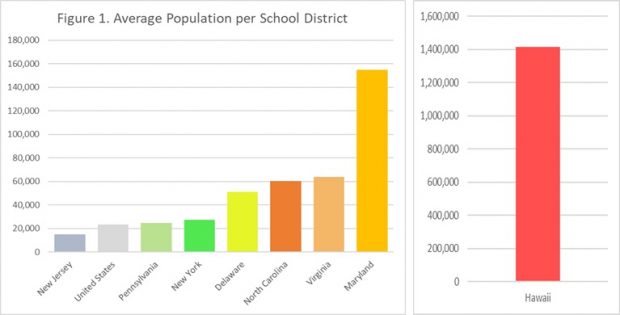
Table 1 and Figure 1 illustrate the statewide patterns in the states from which our comparison counties were selected. (In the bar chart, Hawaii is shown separately, because its population per school district, at more than 1.4 million [the entire population of the state], would make the rest of the graph unreadable.) States not partitioned entirely into MCDs tend to have larger districts, in terms of population served. In the graphics, we will color-code the counties to make patterns easier to discern: New Jersey counties will be shown in blue; New York and Pennsylvania, where districts are organized at the municipal level but tend to serve larger populations than in New Jersey, in green; Delaware in yellow, occupying a middle ground between county-run and municipally-run districts; different shades of orange indicating the three states—Maryland, Virginia, and North Carolina—with countywide school systems; and Hawaii, the only statewide school system, in red.
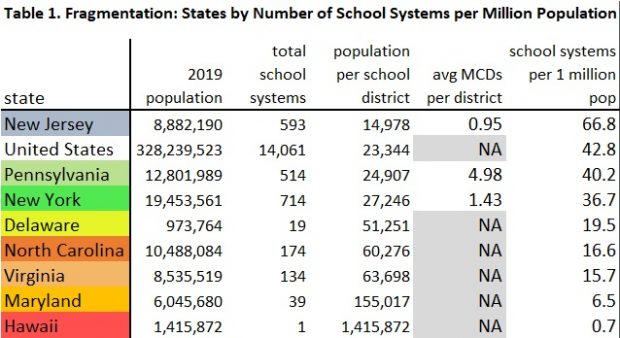
With an average of only 15,000 residents per school district, New Jersey’s public education landscape is more fragmented than in most nearby states.
With an average of only 15,000 residents per school district, New Jersey’s public education landscape is more fragmented than in most nearby states. New Jersey’s average population per school district is the lowest among all states from which counties in our study were included, and is well below the national average. Note that New York and Pennsylvania, like New Jersey, are entirely partitioned into municipalities, and school districts are operated at a sub-county level. But their average populations per district, at around 25,000 to 27,000, are higher than New Jersey’s, which is just under 15,000. In New York’s case, this is mainly because of New York City’s citywide school district pulling the average up; outside New York City, the rest of the state is every bit as fragmented as New Jersey, managing only about 1.4 municipalities per school district. But in Pennsylvania’s case, the reason is that Pennsylvania’s school districts tend to be shared by multiple municipalities; it averages nearly five municipalities per school district, while New Jersey cannot manage even a 1:1 ratio. Despite their similar average district sizes, then, we should probably think of Pennsylvania’s districts as being less fragmented than New York’s, organizationally speaking.
county-run school districts generally serve much larger populations than those run at the sub-county level
The same pattern is evident at the county level (see Figure 2 and Table 2), where county-run school districts generally serve much larger populations than those run at the sub-county level and where, even among the states without county school districts, districts in Delaware and in suburban New York and Pennsylvania are generally larger than those in New Jersey.
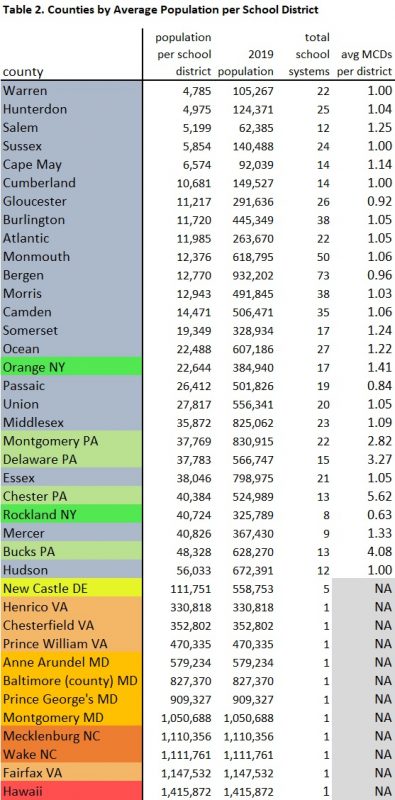
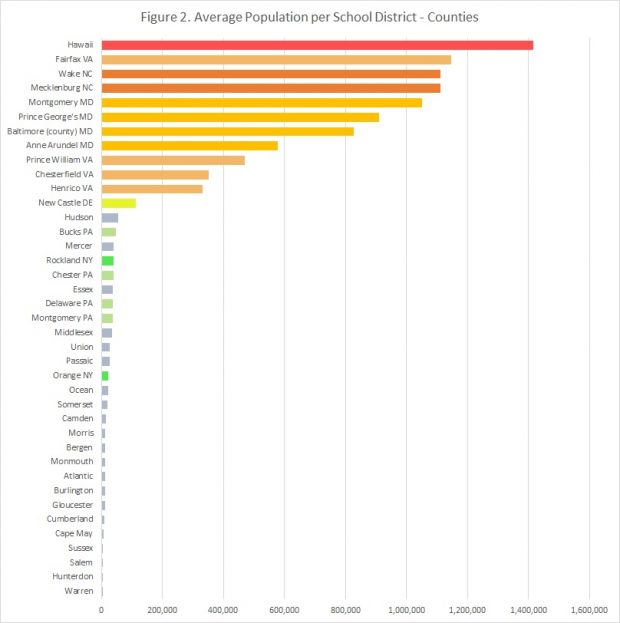
Several New Jersey counties—namely Hudson, Mercer, and Essex—may appear to be less fragmented, in terms of average population per district, but this is because the average district size is dragged upward by the single-municipality districts of one or two large municipalities (Jersey City, Newark, Trenton, Hamilton Township). Even with these large single-municipality districts padding their averages, their average district sizes are still only comparable to those in the New York and Pennsylvania counties and fall well short of the sizes of the countywide districts.
Fragmentation and Concentrated Poverty
From an organizational and funding standpoint, there is reason to suspect that a higher degree of fragmentation might be more likely to lead to concentrations of poverty (as measured by the prevalence of census tracts with a poverty rate of 30% or more). If the competition for commercial and industrial properties and the resistance to residential development become more acute as school districts get smaller, then lower-priced housing is likely to end up being concentrated in a relatively small number of places, mainly those in which housing stocks predate the great mid-20th Century wave of suburbanization and the exclusionary zoning that often accompanied it. With relatively few places offering housing options other than single-family detached homes, and at prices that low- and moderate-income households can afford, such places are likely to contain the bulk of a county or metropolitan area’s lower-income households.
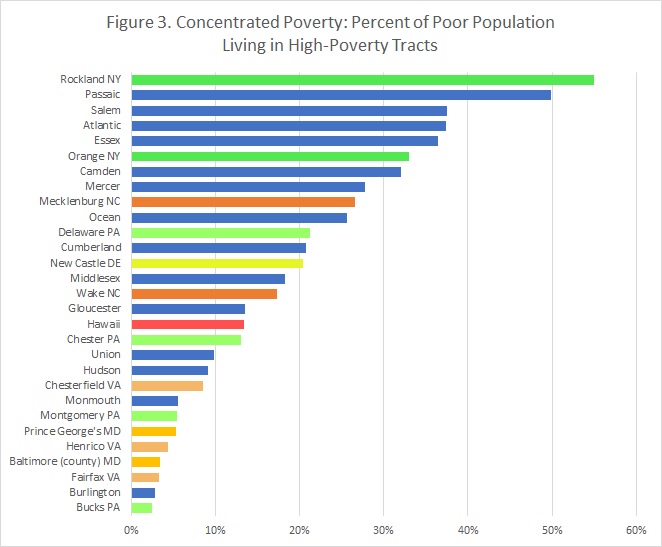
Data on high-poverty neighborhoods appear to bear out this supposition. Concentrated poverty is more prevalent among counties with more fragmented public education systems. Figure 3 indicates what percent of each county’s poor population lives in places where they are surrounded primarily by other poor people—that is, the percent of the county’s poor population that lives in census tracts having a poverty rate of 30% or more. (Of the 39 geographic units in the analysis—38 counties and one state—29 contain at least one high-poverty tract, and these appear in the graph; we will address the remaining 10 counties momentarily.)
New Jersey counties dominate the high end of this list, along with the two counties from New York, the other highly-fragmented state in our study. Meanwhile, the counties with countywide school systems are generally clustered near the bottom. Even the two North Carolina counties, which are each dominated by a single large city, outperform many of the New Jersey counties on the list, despite the fact that large cities are where high-poverty neighborhoods are most frequently found. Burlington and Monmouth are the two New Jersey counties that perform the best, in terms of minimizing the percent of their poor populations living in concentrated poverty. But the broad pattern is clear: The counties with the most decentralized school systems tend to be the most segregated by income.

Concentrated poverty is more prevalent among counties with more fragmented public education systems.

Fragmentation and Concentrated Poverty
Segregation by income and segregation by race often go hand in hand; in fact, one can serve as the pretext for the other. A fragmented governance system like New Jersey’s grants wide latitude about land-use decisions – especially how much and what kind of housing to build – to local leaders who are overly responsive to often relatively small and homogeneous populations of residents. These leaders can become focused on prioritizing the protection of “community character” and the property values of existing residents over the accommodation of potential new residents. Resistance to new residential development is further justified by the fiscal calculus of having to raise revenue for schools from a highly localized tax base. These fiscal and political incentives can lead to entrenched enclaves of affluence that actively seek to exclude anyone who doesn’t look like the people who already live in town, whether the motivation be race- or income-based.
If a fragmented system of public education creates both the incentive and the means to exclude households with lower incomes (whether by design or as a side effect), it should not be surprising if such practices also serve to exclude certain racial minorities, given racial disparities in household income. In New Jersey, median household income for white households is $85,423; for Black households, it is $51,309; for Hispanic households, $54,160. Whether incidental or intentional, segregation by income often results in segregation by race.
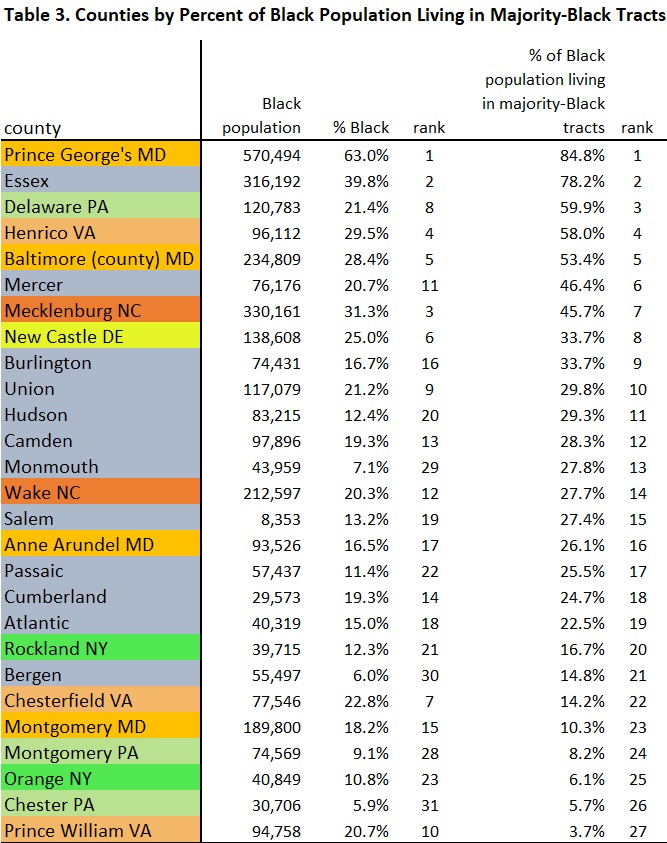
Let us first consider racial segregation for the Black population in terms of how many Black residents live in neighborhoods where their neighbors are primarily other Black people; that is, the percent of the Black population living in majority-Black census tracts. Among the 39 geographic units in our analysis, 27 contain at least one census tract where the population is majority-Black (see Table 3). The resulting pattern does not point to a clear relationship to the level of geography at which school systems are organized. The counties with countywide school districts appear throughout the list rather than being clustered at one end or the other, while New Jersey’s more fragmented counties generally appear in the middle.
Segregation by income and segregation by race often go hand in hand
Notice, however, that counties with high percentages of Black residents living in majority-Black census tracts also tend to have high Black percentages overall. This makes sense, considering the extreme case of a hypothetical county with 100% Black residents, in which case each neighborhood would by definition be majority-Black. What we are interested to see is where majority-Black neighborhoods appear with a frequency out of proportion to the Black share of the population.
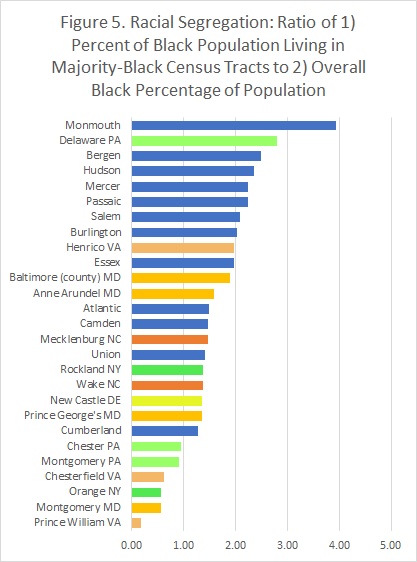
Let us therefore look instead at the ratio of 1) the percent of the Black population living in majority-Black tracts to 2) the county’s overall Black percentage (see Figure 5). When normalized by the overall prevalence of Black residents in the county, it becomes clear that the counties with countywide school districts have much lower degrees of segregation for Black residents. The top of the list is dominated by New Jersey counties, along with Delaware County, PA (though Chester and Montgomery counties in Pennsylvania are much less segregated). Note that Bergen and Monmouth counties in particular, despite having scored very low on segregation by income earlier, now appear at the top of the list when segregation is evaluated on a racial basis.
Counties with less fragmented school systems have much lower degrees of segregation for Black residents.
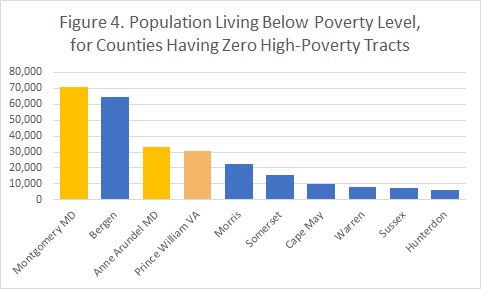
As before, it is also useful to examine the counties not having any majority-Black neighborhoods. Figure 6 shows these counties (plus Hawaii) sorted by total number of Black residents. In most cases, it appears that a lack of majority-Black tracts point to the county simply having a very small Black population to begin with. Fairfax County, VA, is the clear exception, with a Black population exceeding 100,000 (and with a countywide school system) yet with no majority-Black neighborhoods, but Middlesex County is a notable example in New Jersey. Middlesex is one of New Jersey’s six majority-minority counties (i.e. where the population is less than 50% non-Hispanic white), along with Cumberland, Essex, Hudson, Passaic, and Union, but is the only one without a single majority-Black tract, though this is not true when it comes to majority-Hispanic neighborhoods.
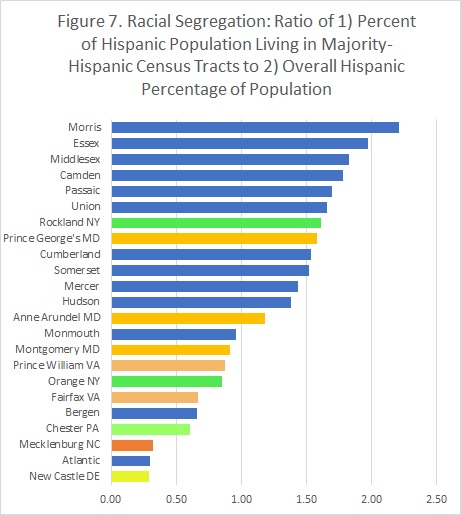
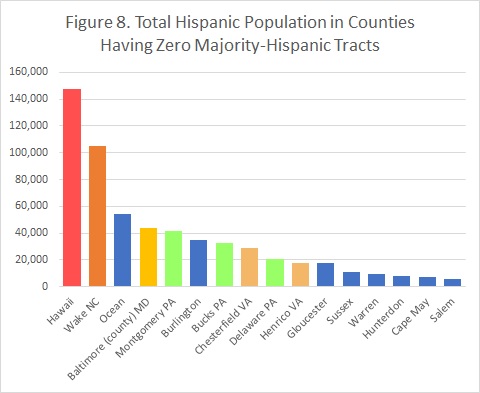
Looking at the Hispanic population, there are 23 counties in our analysis that contain at least one majority-Hispanic census tract, slightly fewer than the 27 that contained at least one majority-Black tract. If we measure segregation of the Hispanic population by looking at the ratio of 1) percent of the Hispanic population living in majority-Hispanic tracts to 2) the county’s overall Hispanic percentage—parallel to our reasoning for the Black population—we once again see that it is counties with more fragmented school systems, mainly in New Jersey, where majority-Hispanic neighborhoods are most prevalent, relative to the county’s overall Hispanic population (see Figure 7). In contrast, many of the counties with countywide school districts have small shares of their Hispanic populations living in segregated neighborhoods, relative to the size of the Hispanic population overall.
Counties with more fragmented school systems, particularly in New Jersey, tend to have the most majority-Hispanic neighborhoods relative to the size of their overall Hispanic populations.
Bergen and Monmouth counties show up as being more similar to the countywide-school counties in terms of Hispanic segregation, similar to their low showing on metrics of segregation by income and in direct contrast to their appearance near the top of the list in segregation of their Black populations. Middlesex County is in the reverse situation, having no majority-Black tracts despite having a sizable Black population, but appearing near the top of the list in terms of segregation for its Hispanic population.
Looking at the Hispanic population, there are 23 counties in our analysis that contain at least one majority-Hispanic census tract, slightly fewer than the 27 that contained at least one majority-Black tract. If we measure segregation of the Hispanic population by looking at the ratio of 1) percent of the Hispanic population living in majority-Hispanic tracts to 2) the county’s overall Hispanic percentage—parallel to our reasoning for the Black population—we once again see that it is counties with more fragmented school systems, mainly in New Jersey, where majority-Hispanic neighborhoods are most prevalent, relative to the county’s overall Hispanic population (see Figure 7). In contrast, many of the counties with countywide school districts have small shares of their Hispanic populations living in segregated neighborhoods, relative to the size of the Hispanic population overall.
Counties in which schools are run by the county are generally less segregated, both by income and race, than are counties where public education is organized more locally (as in New Jersey).
Conclusions
Overall, it certainly appears that counties in which schools are run by the county are generally less segregated, both by income and race, than are counties like New Jersey’s, where public education is organized at the municipal level. Counties in Pennsylvania and Delaware, where schools are organized at the sub-county level but where the districts tend to be larger than New Jersey’s, generally fall somewhere in the middle. Each time our study counties are sorted by a metric of residential segregation, greater fragmentation in the organization of the county’s public schools is associated with greater degrees of segregation, both by income and by race.
Of course, there are many factors behind both economic and racial segregation, and these factors may vary not just from one state or part of the country to another but even from one region to another within a state. And the relationship between school district fragmentation and residential segregation is not necessarily even a causal one; determining an actual path of causation would involve a much more in-depth study. But based on the argument laid out in the discussion of concentrated poverty, and on the results of this analysis, more localized responsibility for school funding would appear to make discriminatory impulses not only more of a cold, calculated fiscal strategy but also easier to carry out via localized land-use decision-making. If we want to address New Jersey’s status as one of the most segregated states in the country, mitigating these incentives by organizing and funding public education at a higher level of government might be a good place to start.