Explore Smart Growth 101

New Jersey Future has identified three main metrics measurable with available data that we believe contribute to a municipality’s livability and walkability. This section provides the methodology to identify and quantify the characteristics of smart growth in your community in order to plan projects more effectively. The three metrics are:
What is your net activity density?
The first of three key metrics of smart growth – how compact the development pattern of a place is – refers to the extent to which activities, whether residential or non-residential, are concentrated near each other. It can be quantified as “net activity density.”
Net activity density is computed as the sum of population and employment for a municipality, divided by the municipality’s developed land area. Net activity density is a more accurate descriptor of a place’s built environment than simple gross population density. It is essential to note that this metric pertains only to the developed portion of the municipality. By using only developed acres as the denominator, rather than total acres, we avoid diluting the value of the statistic through the inclusion of undeveloped land. By counting jobs as well as population, we indirectly account for buildings used for commercial purposes, in addition to residential buildings.
Based on an examination of the distribution of net activity density (population plus jobs per square mile) and a look at a handful of individual municipalities for verification, the following categories were defined:
- Urban = net activity density ≥ 15,000 population plus jobs per square mile
- Small City/Urban Suburb = net activity density between 10,000 and 15,000
- Dense Suburban/Small Town = net activity density between 7,500 and 10,000
- Moderate Suburban = net activity density between 4,000 and 7,500
- Low-Density Suburban = net activity density between 2,000 and 4,000
- Large-Lot = net activity density < 2,000
Places falling into the higher categories indicate a more compact and active area. These places bring destinations closer together, making the area more easily accessible, efficient, and supportive of mixed uses, which is especially important for people with mobility constraints.
Does your municipality have a center or downtown?
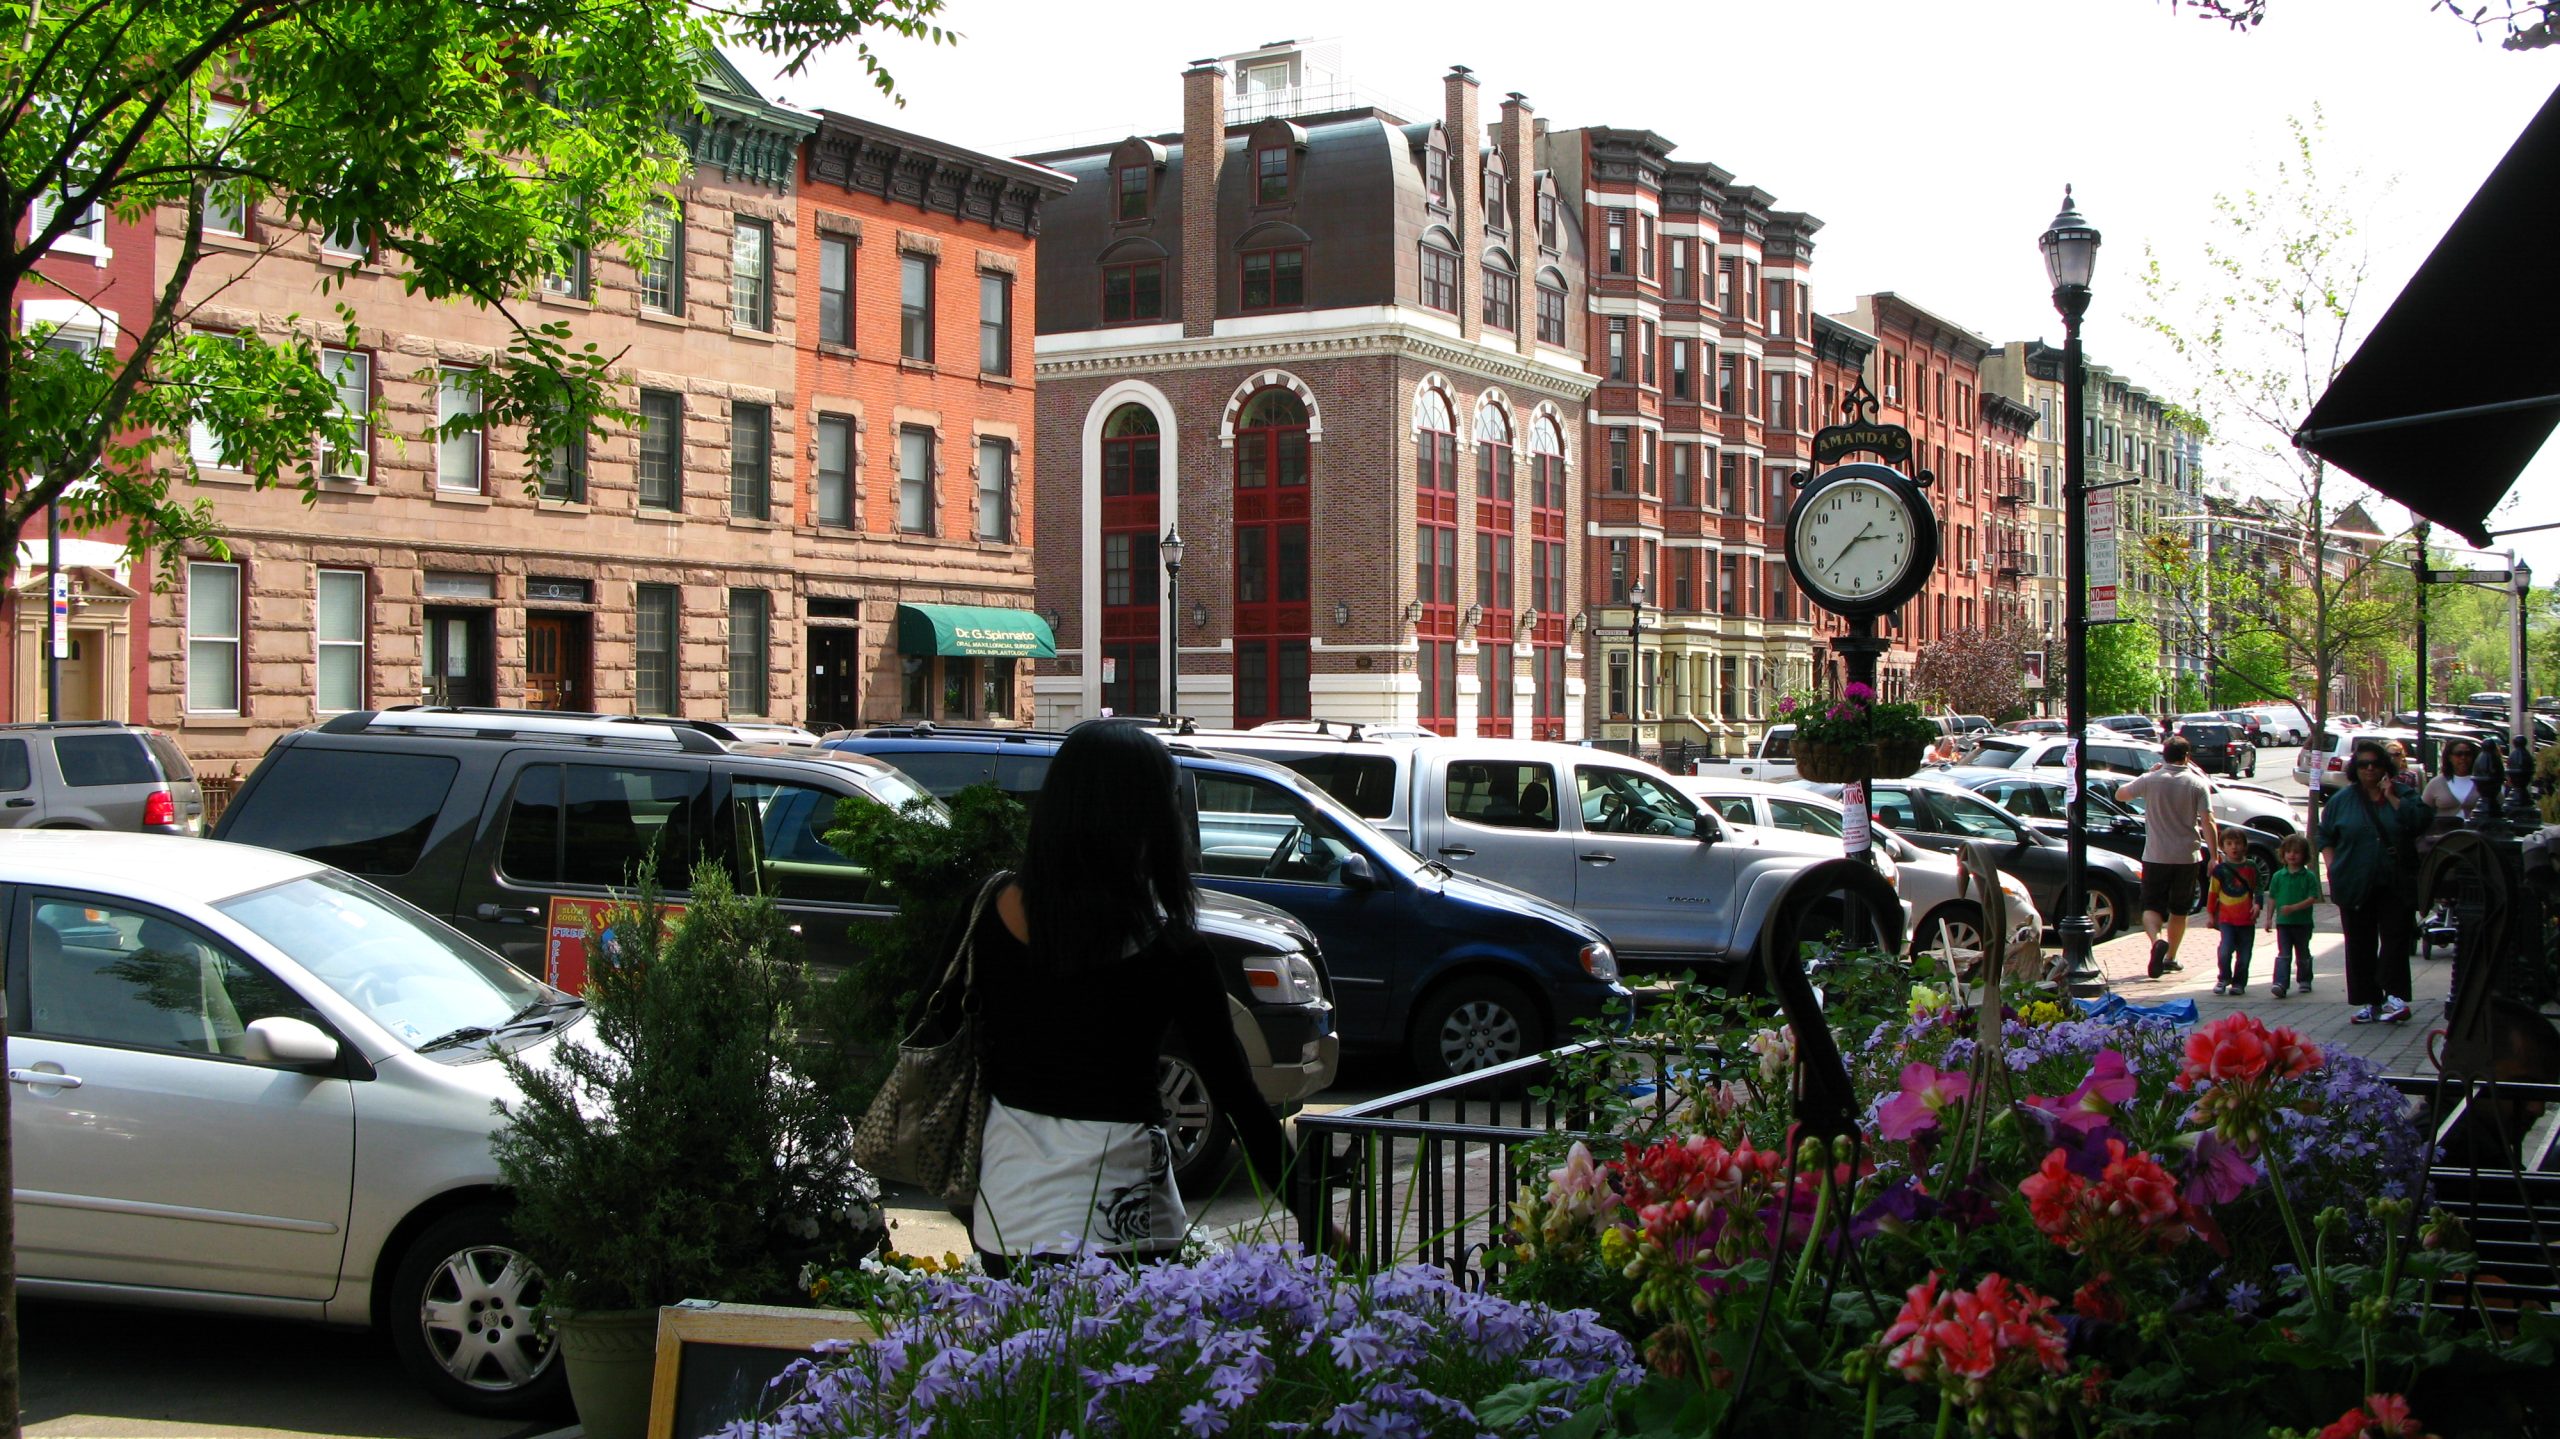
The second component of smart growth identifies the degree to which a municipality hosts a “center,” a part of town where multiple land uses are located in close proximity to one another, as opposed to single-use zoning where different land uses are confined to different quadrants.
Centers concentrate various activities in one place, allowing people to live, work, shop, and access services without the need to drive frequently. They promote walkability, reduce the need for car trips, maximize the utility of a single car trip for those with limited mobility, and foster a sense of community.
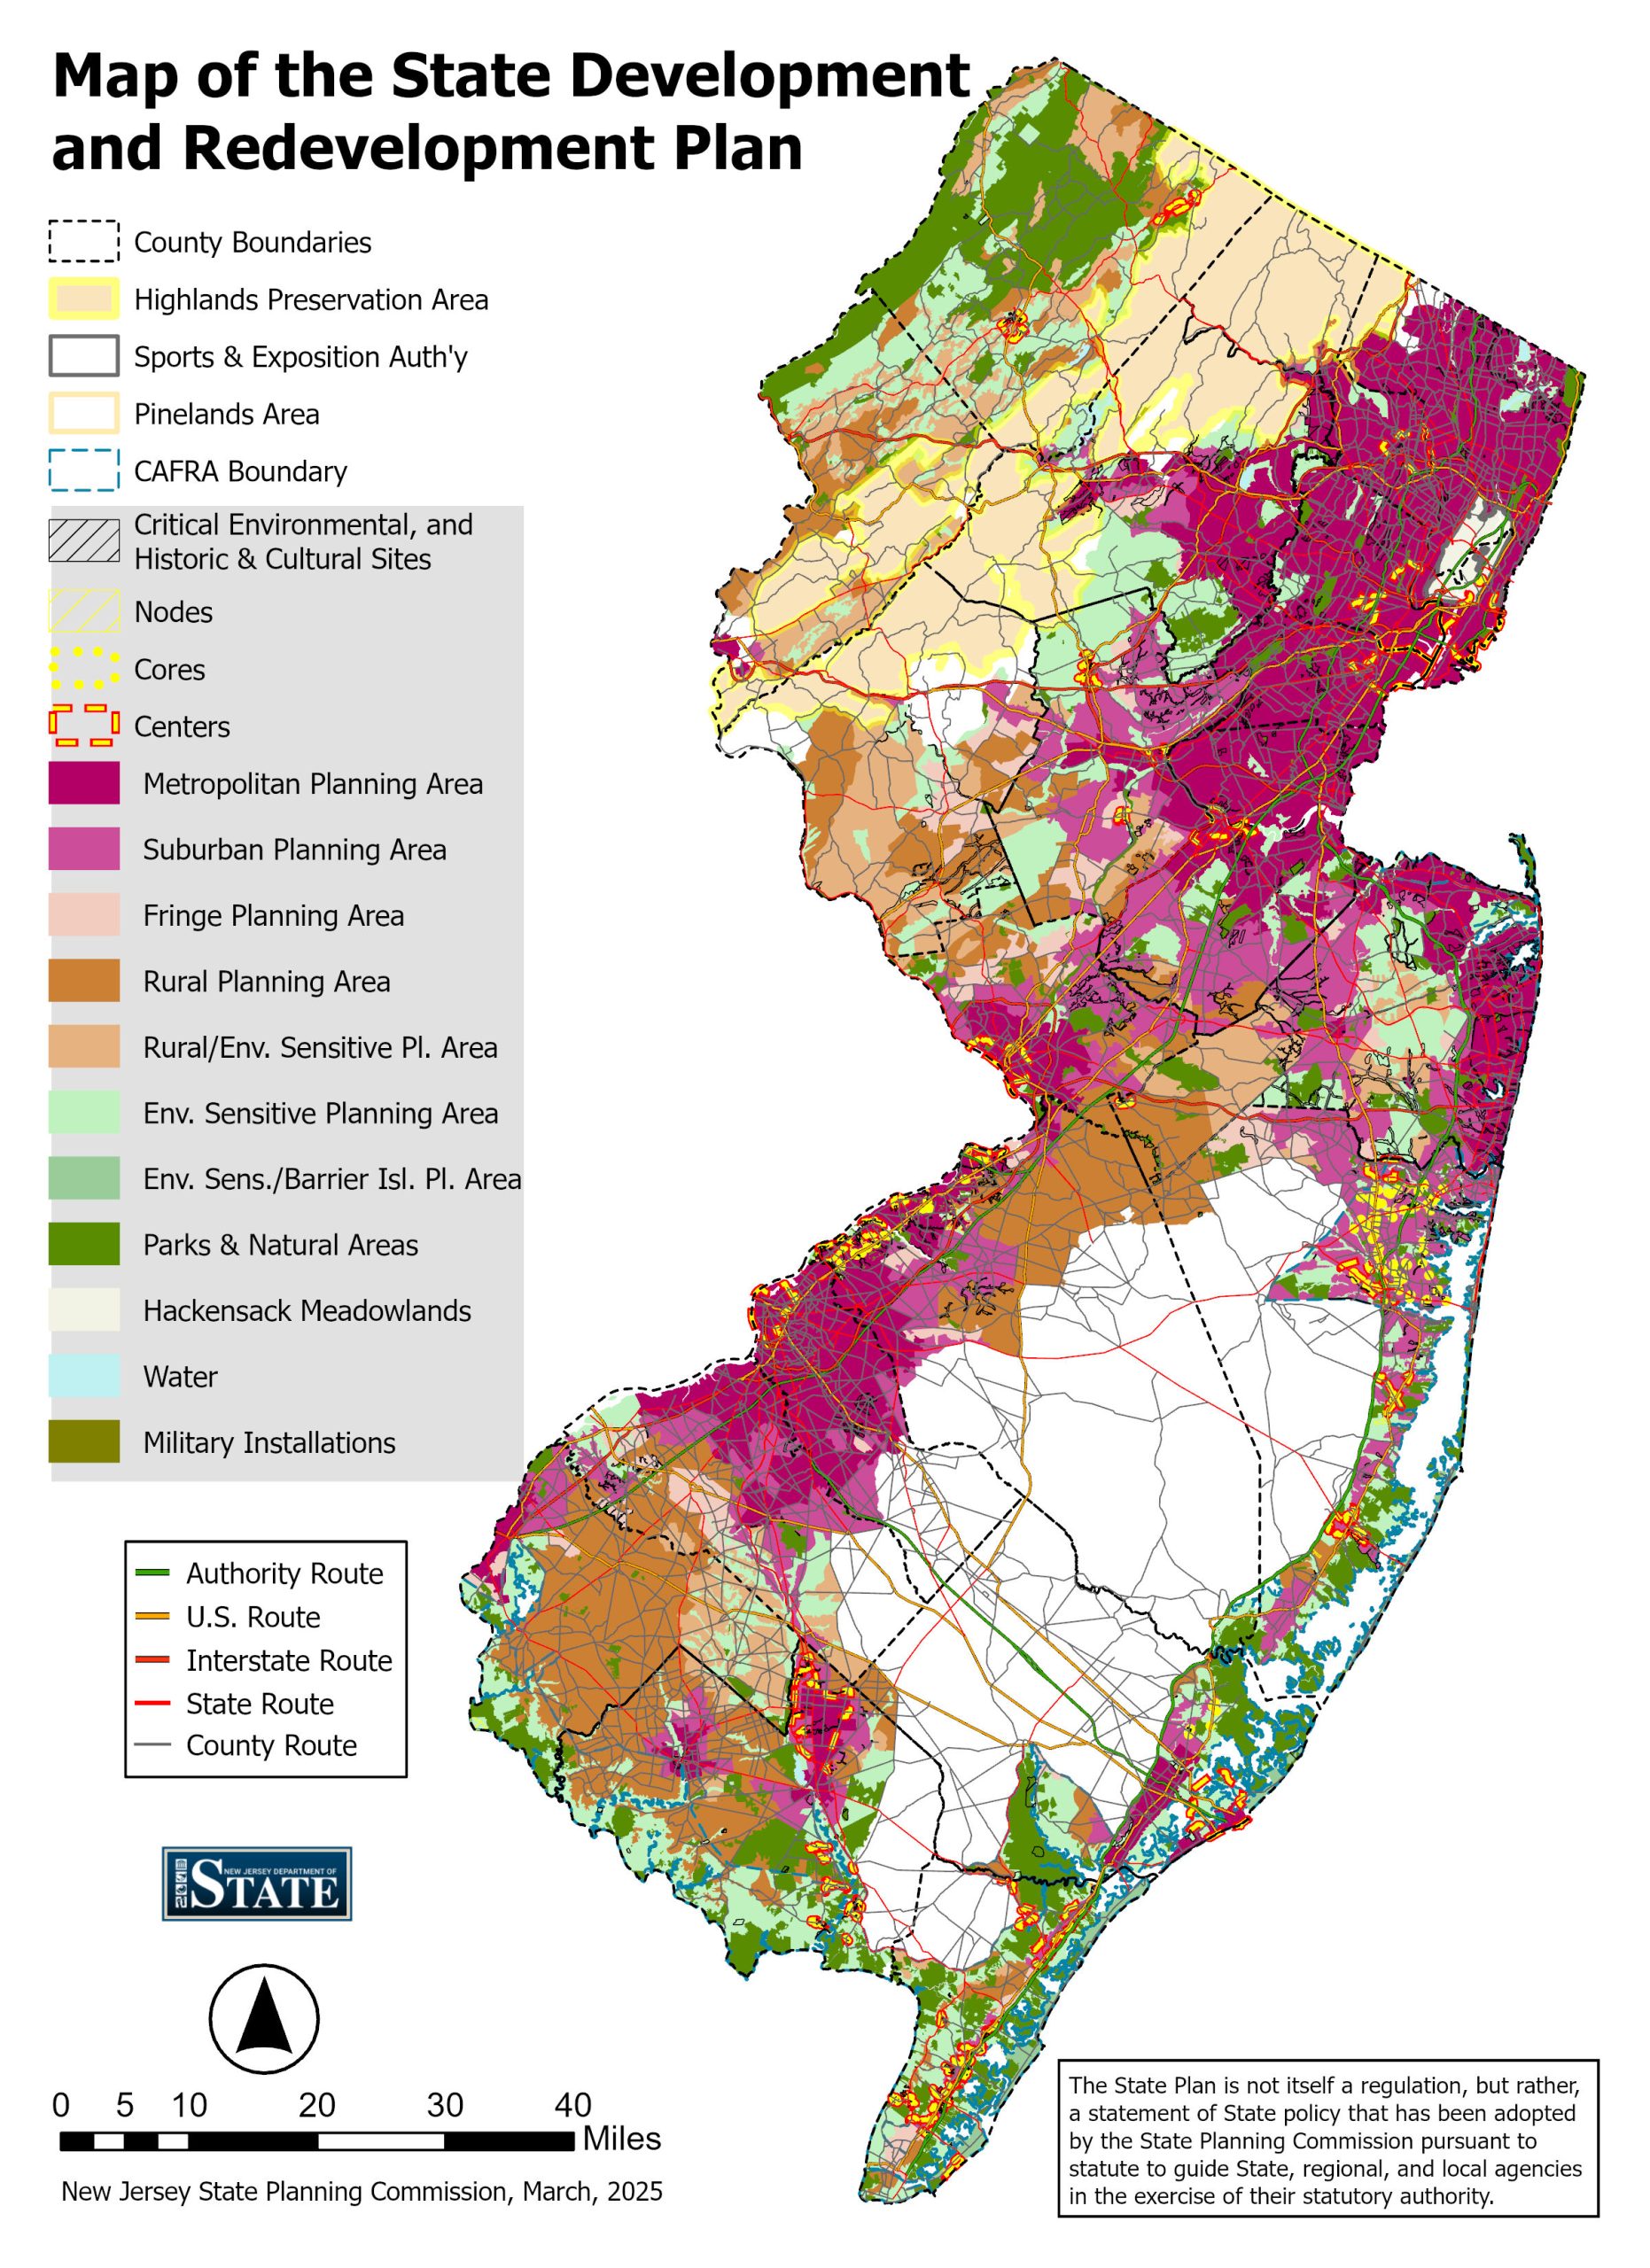
Identifying a “center” is a qualitative metric. New Jersey Future seeks to determine whether the municipality contains at least one center, as defined by several sources. New Jersey’s State Development and Redevelopment Plan (State Plan) is one of those sources. Check the State Plan to see the designation of your municipality.
Many municipalities with functioning traditional downtowns never bothered to apply for State Plan center designation, however, meaning that the State Plan’s list of centers is realistically incomplete. Therefore, we’ve identified any additional municipality as containing a center if it hosts a Business Improvement District (BID) or a “Main Street” or “Downtown” organization.
See Appendix B in New Jersey Future’s Creating Places to Age in New Jersey report for more detail on how centers were identified.
Do you have good street network connectivity?
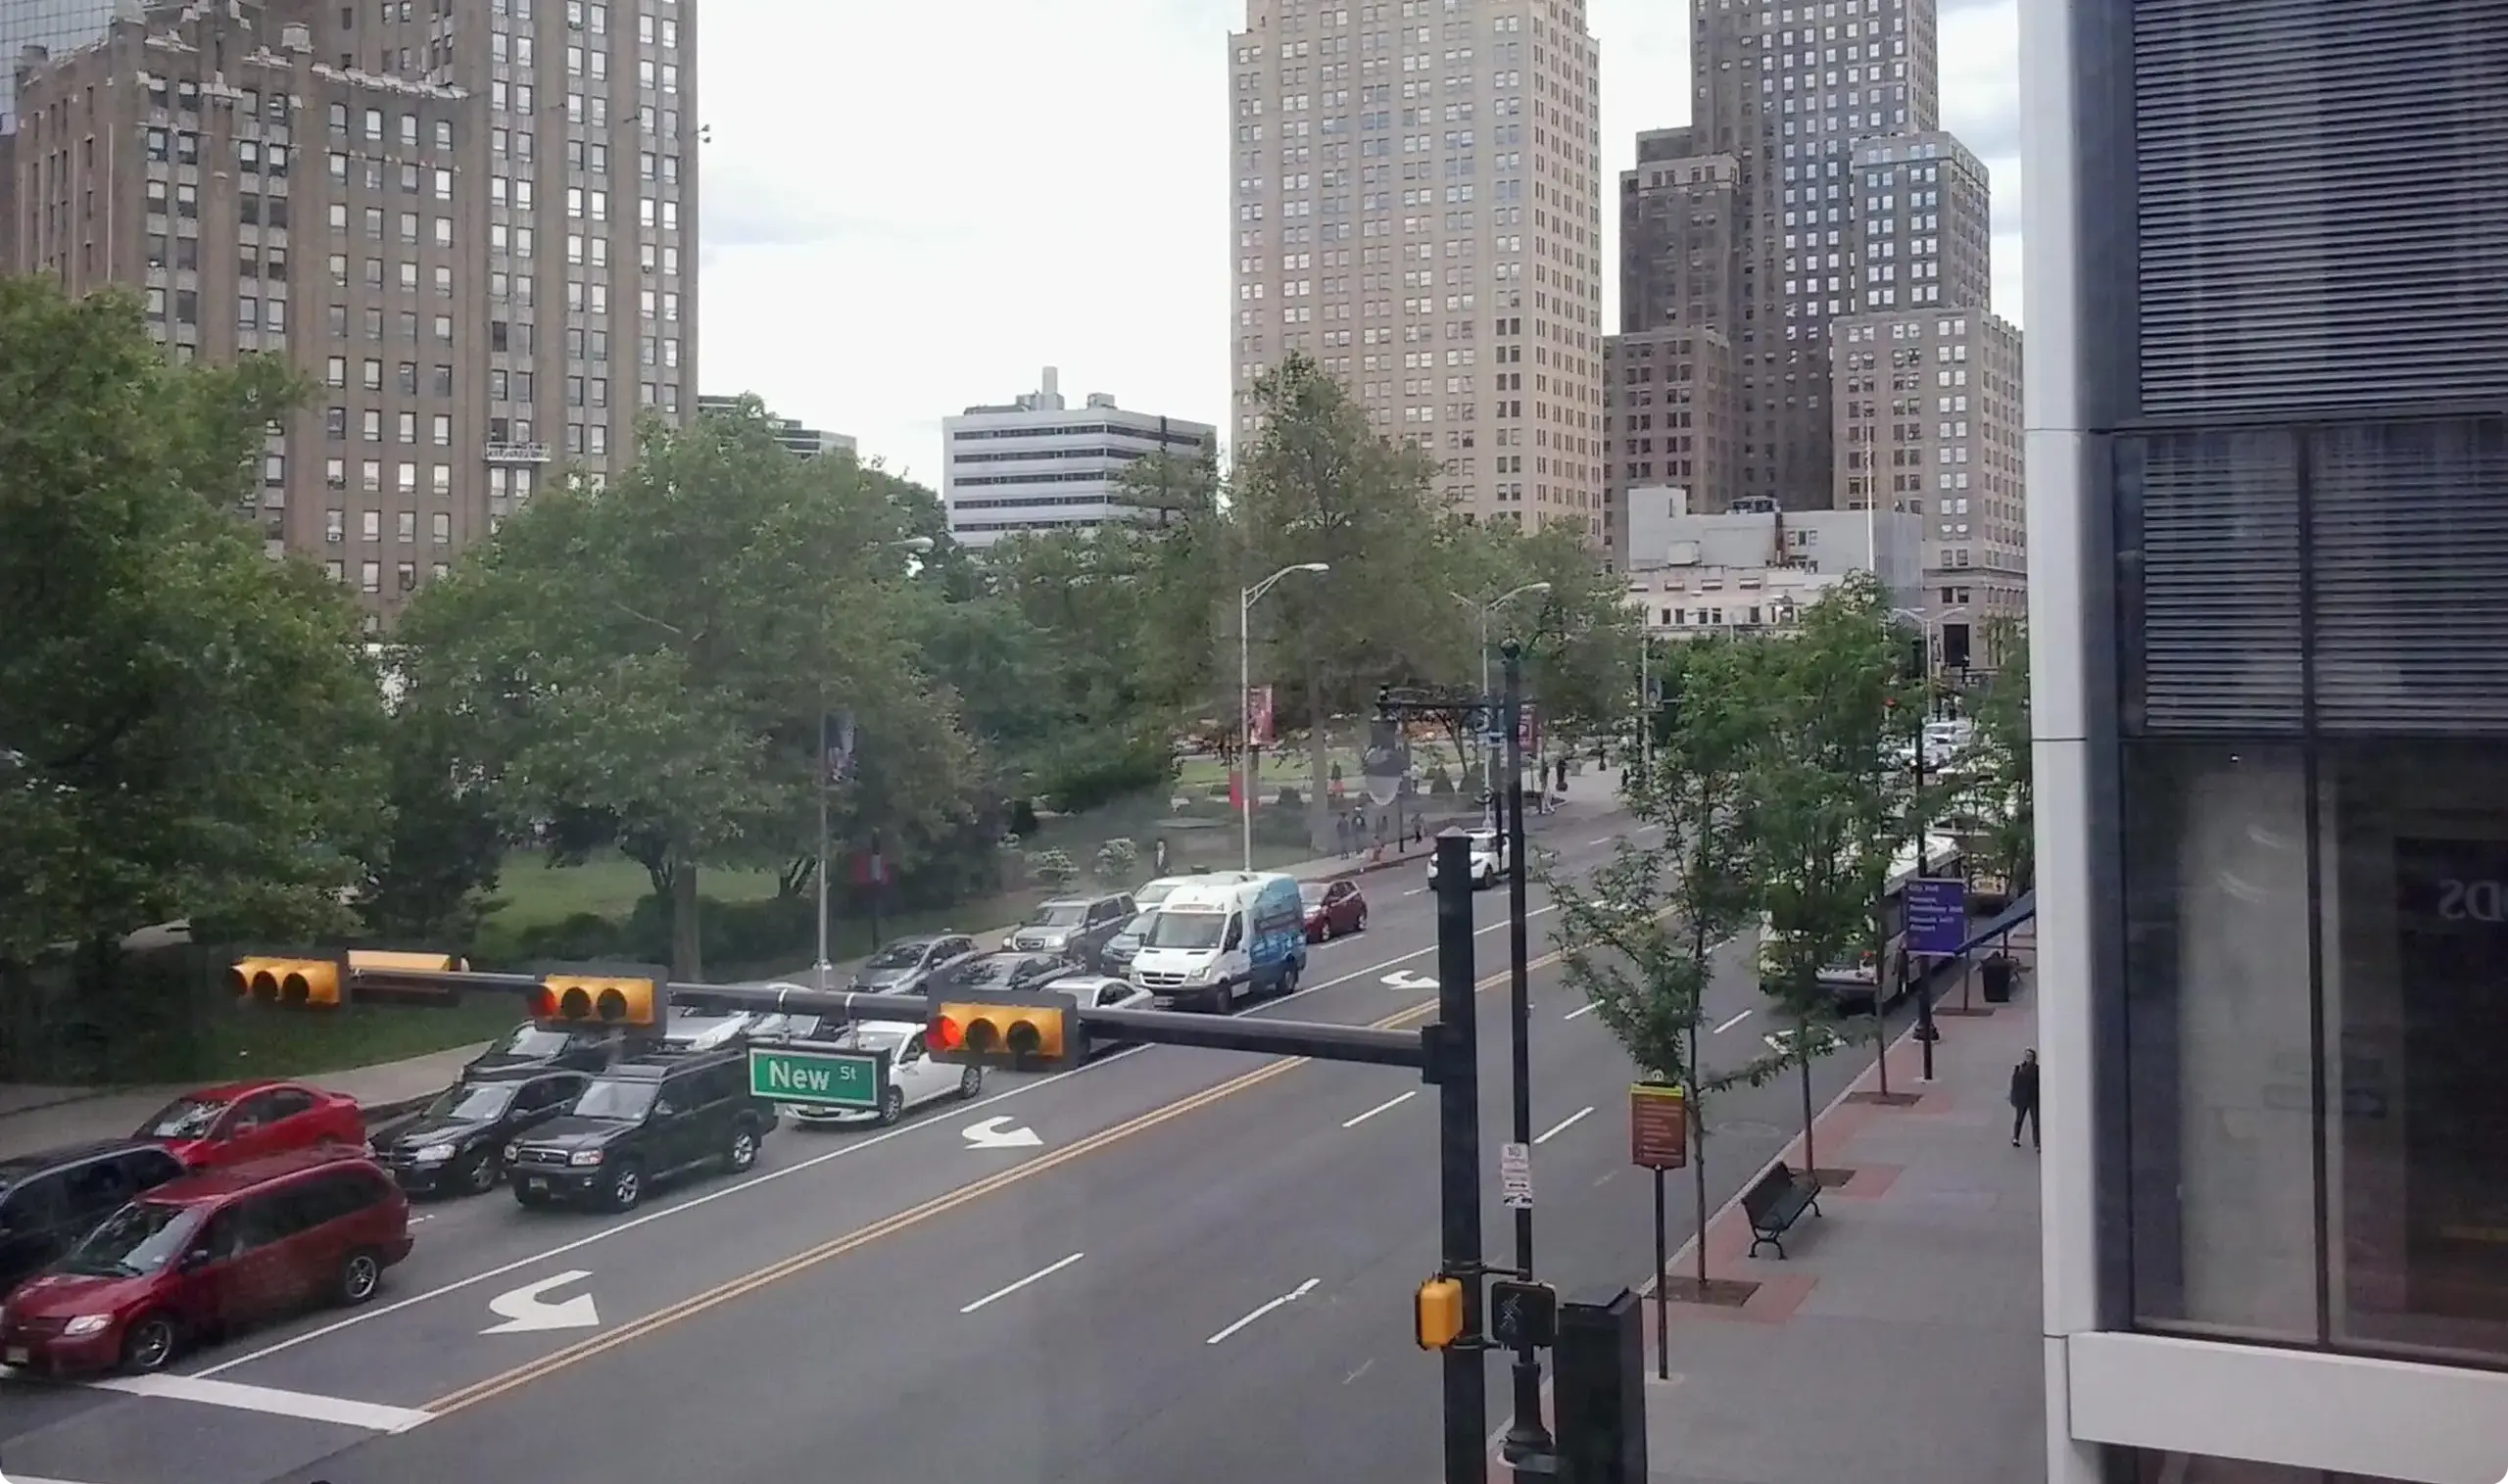
The third key metric of smart growth is the connectivity of the street network. A well-connected, grid-like street network ensures that physical proximity actually translates into ease of access, by providing multiple linkages among properties and neighborhoods so that local traffic isn’t forced onto a few “main” roads for every local trip.
These linkages are important to both pedestrians and drivers. Without connectivity as the third component, high density and mixed use can result in a situation where you can see your destination just on the other side of a fence or row of hedges, but you have to walk or drive a mile to get to it. We measure a municipality’s street network connectivity using median block size, which gives a sense for how long it takes to go “around the block,” whether on foot or by car.
Median Block Size Categories:
- Excellent = < 3 acres (56 municipalities)
- Very Good = 3 – 3.99 acres (106 municipalities)
- Good = 4 – 4.99 acres (110 municipalities)
- Medium = 5 – 6.99 acres (124 municipalities)
- Fair = 7 – 9.99 acres (63 municipalities)
- Poor = 10 – 19.99 acres (55 municipalities)
- Very Poor = 20+ acres (51 municipalities)
Smaller blocks indicate better connectivity and more walkable street networks. A finer-grained street network means more intersections, more routes, and generally shorter walking distances. That’s important for walkability, transit use, and aging in place, as well as reducing dependence on cars.