The Black-White Homeownership Gap in New Jersey
Author: Tim Evans
September 2020
Where we build our housing, the type of housing we build, and for whom we build it affects our environment, our quality of life, and how segregated a state we will live in. The majority of homes in New Jersey (54.0 percent) are single-family detached dwellings. The majority of households in New Jersey (64.0 percent) live in a home that they own. In many individual places within New Jersey, ownership of a single-family detached home is the default. In almost half the municipalities in the state (276 out of 565 municipalities total), more than 70 percent of the housing stock is single-family detached homes; in 190 of these (more than one-third of the state’s municipalities), it’s 80 percent or more.
While homeownership is not necessarily the right choice for everyone, there are reasons to care about it, beyond simply putting a roof over one’s head. Homeownership is one of American households’ primary means of building wealth, because a home is the most valuable asset that most families own, and home values tend to appreciate over time. There is an argument to be made that this should not automatically be the case in an efficiently-functioning market; in any market, increasing prices are a signal that supply is not keeping up with demand, a signal that will tend to stimulate the production of new supply. But housing markets often do not function efficiently; there are significant incentives for existing homeowners to restrict the construction of new supply in their communities, so as to keep upward pressure on home values. While it may be a sub-optimal result from a free-market perspective, however, the fact is that home values do tend to rise over time, and thus homeownership is an important path to wealth accumulation. Given this reality, it is fair to then ask whether this path is equally open to everybody.
A recent study by the real-estate firm Redfin has brought attention to the gap in homeownership rates between white and Black households. The study crunched Redfin’s own data to analyze metropolitan areas and found that, while Black homeownership rates vary widely from one metro area to another, they consistently lag homeownership rates among white households within the metro area.
What does the situation look like in New Jersey? We can use data on housing tenure (owner vs. renter) by race from the 2018 American Community Survey to see how New Jersey fares at the state, county, and municipal level.
In New Jersey, 76.9 percent of non-Hispanic white households own their home, compared to only 41.0 percent of Black households, a difference of 35.9 percentage points. Nationwide, the gap is only slightly smaller, with 72.1 percent of non-Hispanic white households owning their home versus only 41.4 percent of Black households—a gap of 30.7 percentage points.
New Jersey’s Black homeownership rate of 41.0 percent, while slightly lower than the national rate, is actually the 16th highest among the 50 states; it is lower than the corresponding rate in Pennsylvania (42.3 percent), Delaware (49.8) or Maryland (51.8) but higher than New York (31.1) and all six of the New England states, which range from a high of 38.0 percent in Connecticut to a low of 22.8 percent in Maine. So New Jersey compares relatively favorably to the rest of the Northeast and to the rest of the country on this metric, although this is not to say there isn’t still plenty of room for improvement.
Where are county Black homeownership rates the highest?

At the county level in New Jersey, the highest Black homeownership rates (those more than 5 percentage points above the statewide rate) can be found in two groups of counties. One is a group of South Jersey counties—Burlington, Camden, Gloucester, and Cumberland—with Black populations that are similar to or greater than the statewide percentage of 13.6 percent and that tend to have relatively low home prices, especially as compared to the rest of the state, but also compared to suburban Philadelphia counties on the Pennsylvania side of the river. These counties appear to offer the best opportunities for Black households seeking to own their home.
The other is a group of mostly rural and upscale suburban counties with very small Black populations overall—Sussex, Warren, Hunterdon, Morris, Somerset, Ocean, and Cape May. Of this second group, Somerset is the only one with a Black percentage (9.6 percent) that is more than half the statewide percent; the others are all less than 5 percent Black. These counties tend to have housing stocks that are dominated by single-family detached homes, with not a lot of units geared toward renters in general, regardless of race. This suggests that of the few Black households that want to move to the more outlying counties—or can afford the price of entry into the expensive suburban counties—most are going to be homeowners by default, because there are few alternative options. These counties’ relatively high Black homeownership rates, then, are more a function of small denominators (few Black households overall) than of large numerators (large numbers of Black homeowners).
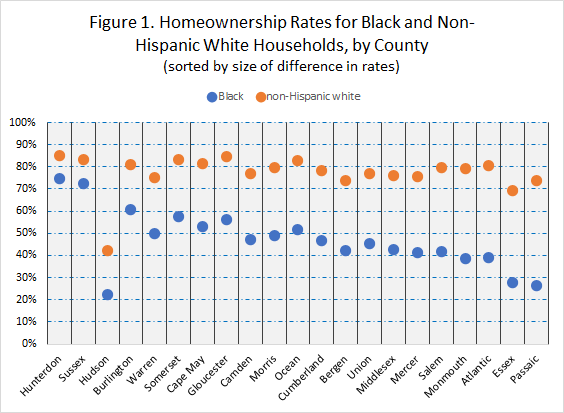
Interestingly, the 11 counties with the highest Black homeownership rates also top the list of counties with the smallest differentials between the Black homeownership rate and the non-Hispanic white homeownership rate – with one addition: Hudson County [see Figure 1]. Overall, a higher rate of Black homeownership is associated with a smaller gap in the homeownership rate between white and Black households. Hunterdon County exemplifies the phenomenon; while only 2.7 percent of the county’s population is Black, a full 74.6 percent of Black households in the county own their home, the highest of New Jersey’s 21 counties. This is only 10.4 percentage points lower than the non-Hispanic white homeownership rate in Hunterdon (85.0 percent), the smallest white/Black gap of any New Jersey county. Sussex County has the second-highest Black homeownership rate (72.3 percent) and the second-smallest white/Black homeownership rate gap (11.1 percentage points), but like Hunterdon, Sussex’s Black population is very small—only 2.3 percent.
Hudson County has the third-smallest gap between the white and Black homeownership rates—19.5 percentage points—but in this case both rates are far below the statewide average. The Black homeownership rate in Hudson County is only 22.5 percent, the lowest of all New Jersey’s 21 counties. But the non-Hispanic white rate is only 42.1 percent. Hudson is one of only two counties in which fewer than half of all households are homeowners (Essex is the other), and the only one in which fewer than a third (31.5 percent) of households own their homes. Hudson County’s housing stock is much more geared towards renters than is true in most of the rest of the state, so while very few Black households in the county own their home, relatively few households of other races are homeowners, either.
Highest rates of Black homeownership are found in municipalities with high home values and few Black residents
Parallel patterns of Black homeownership can be seen at the municipal level. Analogous to Hunterdon and Sussex counties—high Black homeownership but low Black population overall—are the 79 municipalities that can claim 100 percent Black homeownership, per the American Community Survey. In 60 of these places—three out of four—the population is less than 3 percent Black; in only two of them does the Black percent of the population exceed 10 percent—Chesterfield Township in Burlington County (18.6 percent) and Logan Township in Gloucester County (12.4 percent). Again, in most of these places, the high Black homeownership rate is not as good news as it seems, because it is due mainly to a very small Black population overall.
In general, the rate of Black homeownership, the overall homeownership rate, and the homeownership gap between Black and non-Hispanic white households all tend to decrease as the Black percentage of the population rises [see Table 1]. Black households are more common in places with lower homeownership rates and with housing stocks oriented more towards renters. At one extreme are the 84 municipalities reporting no Black-headed households at all1, and hence a Black homeownership rate of zero. Collectively, these municipalities have an overall homeownership rate of 84.8 percent and a non-Hispanic white ownership rate of 85.8 percent. These places also have expensive housing stocks: The median municipality among these 84 has an average home value of more than $400,000.
Among the much larger group of 307 municipalities having a non-zero number of Black homeowners but low overall Black percentages of the population (less than 6.8 percent, or half the statewide percentage), the combined Black homeownership rate is 44.4 percent, higher than the statewide rate of 41.0 percent but much lower than the 79.3 percent rate for non-Hispanic white households in these same municipalities, for an ownership gap of 34.9 percent. In this group, the median municipality has an average home value of $360,655, slightly below the statewide average but well above typical values in places with larger Black populations.
Table 1. Larger Black populations are associated with lower Black homeownership rates and lower home values but also with smaller Black/white homeownership gaps
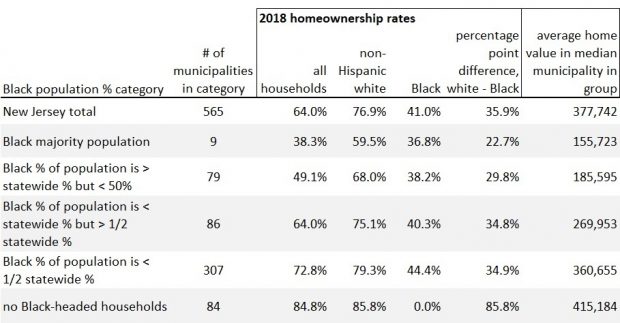
Source: 2018 American Community Survey; one-year version for statewide totals, five-year version for municipal analysis
Interestingly, and in contrast to the pattern seen at the county level, at the municipal level, the gap between the Black homeownership rate and the rate for non-Hispanic white households tends to shrink as the Black percentage of the population increases. The Black homeownership rate tends to fall as the size of the Black population increases, but the homeownership rate for non-Hispanic white households falls even faster, resulting in a smaller disparity between the homeownership rates. So while at the county level the smallest disparities between the Black and non-Hispanic white homeownership rates could generally be found in the places with the highest Black homeownership rates, the reverse is true at the municipal level, where smaller disparities in homeownership rates are associated with lower homeownership rates overall, both among Black households and others. That is, the pattern at the municipal level is more typical of Hudson County in Figure 1 than of Hunterdon and Sussex. This is probably because most Black households live in places that look more like Hudson County than Hunterdon or Sussex.
Low homeownership rates and low home values – the legacy of discrimination
Another phenomenon visible in Table 1 is that higher Black population percentages tend to be associated not only with lower homeownership rates but also with lower home values. Note that in the upper rows of the table, where the Black percent of the population exceeds the statewide percentage, average home values are typically less than half of what they are in the groups of municipalities in the lower rows of the table, where Black populations are small. Lower home values are usually an indicator of a cheaper housing market in general (for both owners and renters), making these places accessible to greater numbers of households of more modest financial means, many of whom are non-white.
A higher Black percentage tends to result in less disparity in homeownership between Black and non-Hispanic white households, but at the price of both lower home values and lower homeownership rates overall. This relationship hints at some of the past discriminatory housing policies—redlining, restrictive covenants, racial steering by real estate agents, as well as the ongoing phenomenon of exclusionary zoning—cited by the Redfin study as contributing to the homeownership gap. Many of the places with the highest homeownership rates overall also have high home values, with both conditions often being the logical result of local growth policies designed to discourage a diversity of housing options and put upward pressure on prices. This lack of options renders these places effectively off-limits to households of more modest means, including many non-white households. (In New Jersey, median household income for white households is $85,423; for Black households, it is $51,309. So discrimination based on income, whether direct or indirect, tends to translate into discrimination based on race.) Having been thus excluded from whole swaths of the state, non-wealthy, non-white households end up concentrating in a relatively small number of places with more diverse housing stocks but where values tend to be low. However well it may perform relative to other states on Black homeownership, New Jersey clearly has a long way to go before it can claim that all parts of the state are equally accessible to everyone.
Bastions of Black homeownership
Not all Black households are concentrated in municipalities with low homeownership rates, however. The nine municipalities in the state with majority-Black populations—Orange, East Orange, Irvington, Hillside, Roselle, Trenton, Willingboro, Lawnside, and Salem—run the gamut of homeownership profiles. Their Black homeownership rates range from a high of 82.3 percent in Willingboro to a low of 23.1 percent in Orange [see Table 2]. In four of the nine, the Black homeownership rate exceeds the statewide rate for Black households. In Willingboro, Lawnside, and Hillside, the Black homeownership rate exceeds the statewide rate for all households.
Table 2. Majority-Black municipalities tend to have disparities between Black and non-Hispanic white homeownership rates that are smaller than the statewide gap, irrespective of Black homeownership rate
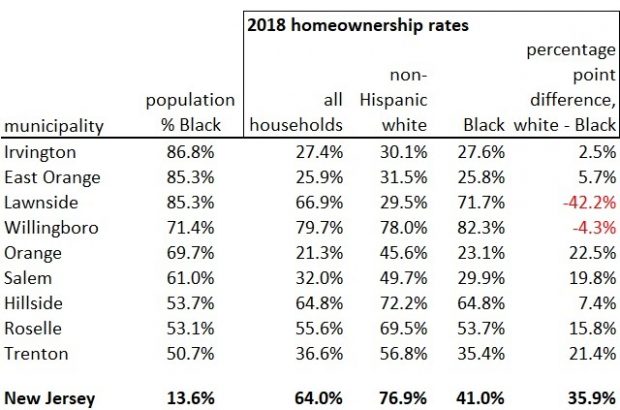
All nine of these municipalities have much smaller gaps between the Black and non-Hispanic white homeownership rates than the state average. In Willingboro and Lawnside, in fact, the Black homeownership rate exceeds the rate for non-Hispanic white households, though both places are less than 15 percent non-Hispanic white. In the four with the lowest Black homeownership rates—Salem, Orange, East Orange, and Irvington—the rates are all below 30 percent, but the homeownership rate for all households is at or below 32 percent for all four, and even the homeownership rate for non-Hispanic whites is under 50 percent.
Much of the difference in homeownership rates within this group is likely explained by the differences among their housing stocks. In Irvington, Orange, and East Orange, less than 20 percent of the housing stock consists of single-family detached homes, indicating a housing supply much more geared toward renters than owners, regardless of race (similar to Hudson County in the earlier example). In Willingboro and Lawnside, meanwhile, single-family detached homes make up more than 80 percent of the housing stock. The places where one finds a lot of Black homeowners thus tend to be places where one finds not only a lot of Black households but also a lot of single-family homes.
The geographic patterns of disparity between white and Black homeownership rates are not an accident, nor are they the natural result of a freely functioning housing market. They are the artifact of a history of racial discrimination and segregation that New Jersey needs to confront. Understanding where – and why – the disparities are greatest or lowest can point toward housing strategies that can expand opportunities for everyone, putting New Jersey on a path toward becoming a more equitable and inclusive state.
1 Note that this does not necessarily mean all of these places have zero Black residents; rather, it means that any Black residents are either living in group quarters or live in households where the head of the household is not Black. In fact, there are 39 municipalities in New Jersey with zero Black residents, as of the 2018 five-year American Community Survey.


