New Jersey Future Blog
Award-Winning Map Shows Water-Related Environmental Justice Issues in New Jersey
June 30th, 2022 by Guest Author
By Drew Curtis, Pablo Herreros Cantis, Bill Cesanek, Rachel Dawn Davis, Amy Goldsmith, and Andrew Tabas
Download the Spanish Translation. (Español)
The Summer 2021 floods in New Jersey, none more widespread and damaging than following Hurricane Ida, showed the damage that stormwater can wreak on communities. New Jersey Department of Environmental Protection (NJDEP) anticipates that rainfall intensity will increase due to climate change, meaning that flooding will become more frequent. To prepare for future floods, it is essential to understand which areas are at risk of flooding and which communities are in harm’s way.
Jersey Water Works (JWW) developed the NJ Water Risk and Equity Map to gather data on water risks and to understand the potential inequities tied to them. By water risks, we mean a group of public health- and safety- related challenges that are relevant to New Jersey’s communities (such as flooding, lead in drinking water, and surface water quality). The map allows users to explore data showing the different water risks considered, with the aim of helping both NJ residents and decision makers visualize the communities that are most affected by them. Showing the distribution of water-related risks can motivate local and state government officials, advocates, and residents to seek to address these issues.
In 2022, the Water Risk Equity Map was selected for the Water Data Prize in the Equity Category. Read more in this press release!
These two case studies show how the map can be used to understand water and equity issues in New Jersey.
Case Study 1: Visualizing the Impact of Hurricane Sandy on Jersey City’s Overburdened Communities
The first case study examines the impact that Superstorm Sandy had in Jersey City.
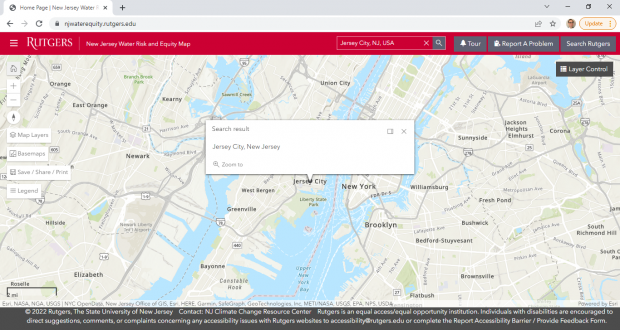
Use the search to find Jersey City.
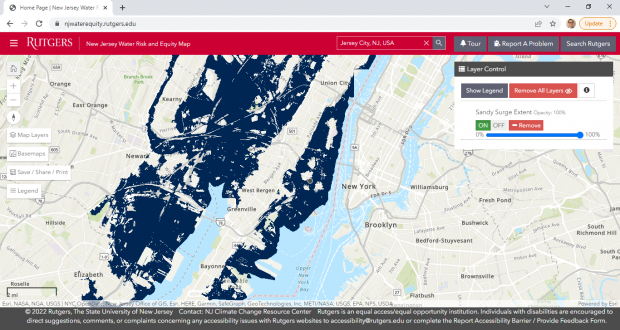
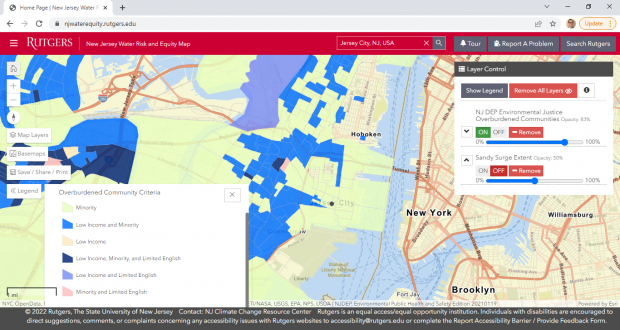
 Load the layer that shows the areas inundated due to Sandy by clicking on the “Map Layers” button → “Water Risk Data” → “Flood Risk Data” → “Sandy Surge Extent”. Displaying the layer shows that a substantial part of Jersey City was impacted by Hurricane Sandy.
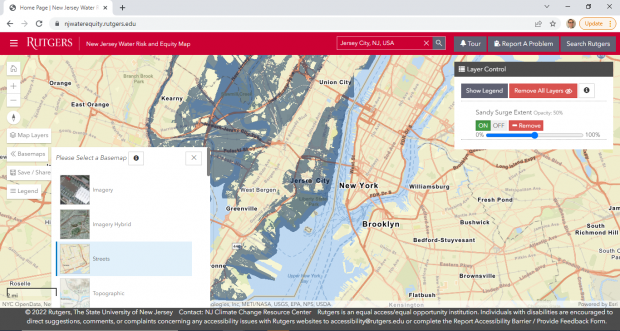
It is possible to change the basemap and the transparency of the layer so that it is easier to read the names of the streets that were affected by the storm. To do this, click on the “Basemaps” panel on the left side of the screen. To change the layer’s transparency, slide the button on the upper right under the Layer Control panel.
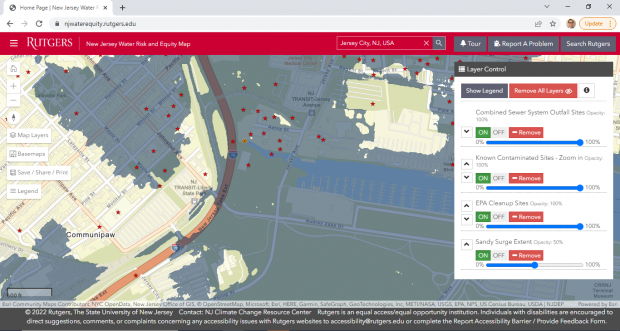
 Now that the layer’s setting and the basemap have been configured, it is possible to zoom into any particular area of interest. For example, we can zoom into the area known as Mill Creek. As the image below shows, Mill Creek was severely affected by Hurricane Sandy, and is known to be a breach point for flooding during storm surge events. The area is also exposed to Combined Sewer Overflow (CSO) discharges, and has several polluted and federally-recognized Environmental Protection Agency (EPA) cleanup sites. CSO outfalls, known polluted sites, and EPA cleanup sites can be added to the map by accessing the layers under “Map Layers” → “Water Risk Data” → “CSO/MS4 Outfalls and Polluted Sites.”
 Finally, the tool includes socioeconomic data relevant to identifying vulnerable communities. For example, it is possible to display overburdened communities (as defined by NJDEP). NJDEP defines “overburdened communities” as areas with 35% or more low-income households, 40% or more Black, Indigenous, or People of Color (BIPOC) residents, or 40% or more limited English proficiency households. As the legend shows, Jersey City has several overburdened communities due to areas that meet the threshold for BIPOC residents, low-income households, or both.
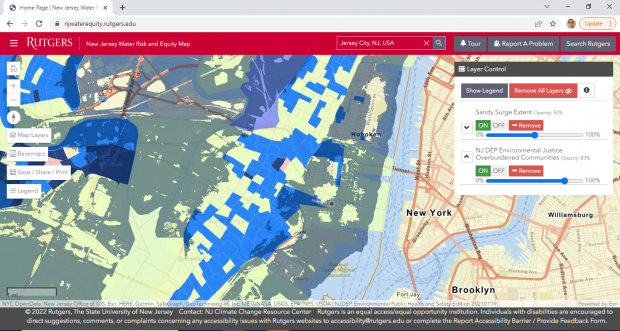
If the Hurricane Sandy surge extent area is reactivated, it becomes clear that many of these vulnerable communities were directly impacted by flooding during the superstorm. The case of Jersey City is comparably different to its neighbor municipality Hoboken, which, while severely affected by Superstorm Sandy, shows a much lower amount of overburdened communities.
 Case Study 2: Hotspots in South Jersey
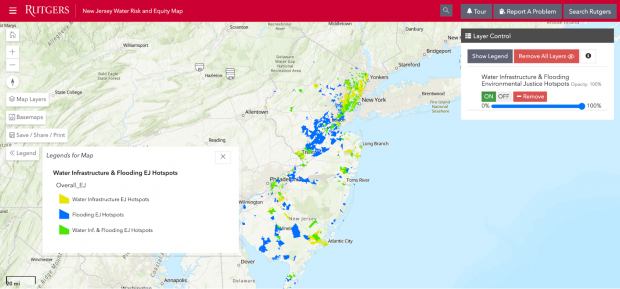
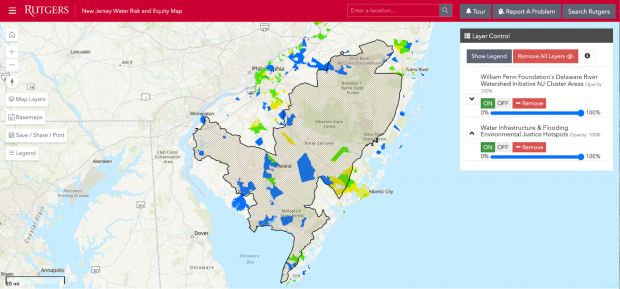
The second case study examines South Jersey with the aid of the new “hotspot” layer. Hotspots are areas where overburdened communities face high levels of water risks. The map identifies two types of hotspots: Flooding Environmental Justice (EJ) Hotspots and Water Infrastructure Environmental Justice (EJ) Hotspots. (For an explanation of the data that is included in these hotspots, visit our Introduction page.)
First, pull up the Hotspots layer. Areas in blue are Flooding EJ Hotspots, areas in yellow are Water Infrastructure EJ Hotspots, and areas in green are both.
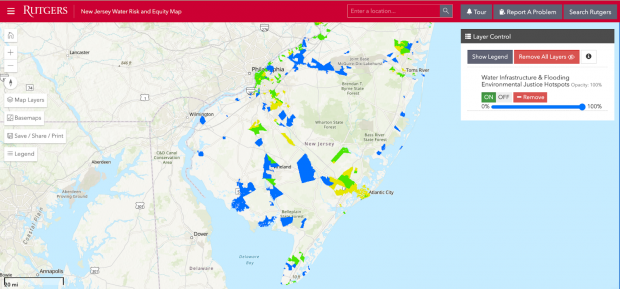
 Second, zoom in on South Jersey. As you can see, there are Flooding EJ Hotspots in Vineland, Bridgeton, and Willingboro, among other areas in New Jersey. There are Water Infrastructure EJ Hotspots around Atlantic City. Some areas are both Flooding EJ Hotspots and Water Infrastructure EJ Hotspots, including Camden, Toms River, and parts of Cape May County.
 Third, add the area of the Kirkwood-Cohansey aquifer to determine which of these areas are near the drinking water aquifer.
 These hotspots are a way to start to explore trends in the data. Remember that many decisions go into building these hotspots. For example, the map highlights overburdened communities to draw attention to environmental justice issues, which means that areas that experience water risks but do not have overburdened communities are not labeled as hotspots. Also, the combination of layers that are included in the analysis necessarily chooses some layers (like the Federal Emergency Management Agency (FEMA) 100-year floodplain) while leaving out others (like brownfields). The Water Risk Equity Map Subcommittee determined the layers that it wanted to include in the hotspot analysis. Map users are encouraged to explore the layers that are most important to them.
To explore the layers that are a priority for you, head to the map and try it out!
Mapping is a powerful tool that can shed light on the environmental risks faced by our society. We hope that you find the Water Risk Equity Map to be an informative tool that is useful in your education and outreach efforts.
Related Posts
 October 12, 2023 The NJ State Development and Redevelopment Plan is Being Updated – Where and How Should New Jersey Grow? Add Your Voice!
 July 17, 2023 Planning for Climate Resilient Stormwater Infrastructure
 October 21, 2022 New Jersey Future Shapes and Supports New Flood Disclosure Legislation
 August 16, 2022 New Jersey Future Provides Direction at Joint State Senate and State Assembly Climate Hearing
 July 17, 2024 Heat, Air Quality, and Hope: Community Research and Resilience in Elizabeth, NJ
Tags: climate change, data, environmental justice, equity, flood, flood risk, flooding, Jersey Water Works, map, NJ Water Risk and Equity Map, storm, Water Data Prize


