New Jersey Future Blog
Ten Years After Sandy, a Look at Population and Housing Trends at the Jersey Shore
October 25th, 2022 by Tim Evans
Both before and after Superstorm Sandy, the trend at the Jersey Shore has been toward higher home values, a smaller percentage of housing units being occupied year-round, and an increasing presence of retirees among year-round residents. Is the Shore becoming a playground for the rich? And specifically rich retirees?
On the occasion of the tenth anniversary of Superstorm Sandy, we took the initiative to examine a looming question: how have New Jersey shore towns changed, in terms of the year-round vs. seasonal nature of their populations and housing stocks, in the wake of such a major flooding event? We are interested in towns that function as second-home or vacation-rental destinations and are dependent on seasonal visitors1, as opposed to year-round towns like Long Branch, Asbury Park, and Atlantic City, which face a different set of issues.
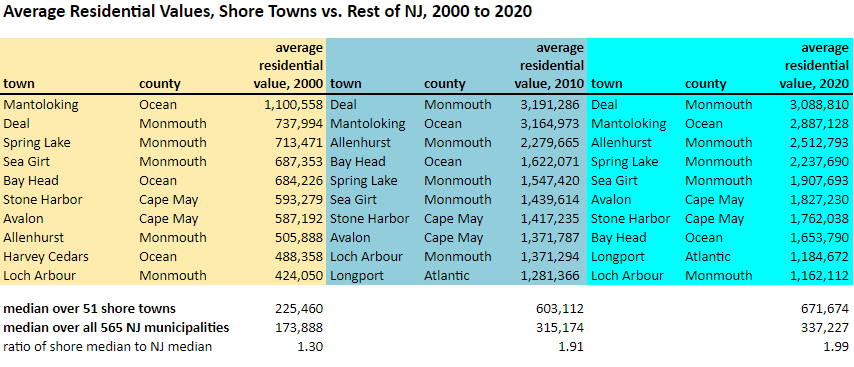
Home values in shore towns are expectedly high, but the differential is getting more conspicuous over time. Among the 51 towns, 38 had an average residential value in 2020 that was higher than the median municipal average of $337,2272 over all 565 NJ municipalities. This is similar to the situation in 2010, when 39 shore towns had average home values that exceeded the municipal median of $315,174. But the number is up from what it was in 2000, when 32 shore towns were above the municipal median. The upward trajectory of home values at the shore relative to the rest of the state was in place well before Sandy made landfall in 2012.
The values in these shore towns are not just high, they are significantly higher than the state median municipality’s average value. Among the 38 shore towns with 2020 average home values that exceeded the median municipal value, a full 25 of them had average values that were more than double the average value in the median municipality. Only 75 municipalities in the entire state exceeded this threshold, meaning that one-third of these high-value places statewide are shore towns, even though the shore towns make up fewer than one in ten municipalities overall. Among the 23 municipalities statewide having an average residential value of more than $1,000,000 in 2020, 13 were Shore towns, including eight of the top 11 (Deal, Mantoloking, Allenhurst, Spring Lake, Sea Girt, Avalon, Stone Harbor, and Bay Head).
Direct access to the ocean appears to be driving housing values. Most of the 13 Shore towns in which the 2020 average residential value is not higher than the median municipality’s tend to be the ones with substantial inland territory (e.g. Stafford, Ocean, and Eagleswood townships in Ocean County and the large mainland townships of Cape May County) and/or which front mainly on a bay rather than directly on the Atlantic (e.g. West Wildwood, Ocean Gate). In other words, most of the lower-value shore towns are places where few if any homes are within walking distance of the Atlantic Ocean itself, and even if you live “down the Shore,” you still drive to the actual beach. The only exceptions are Seaside Heights, Ventnor City, and Wildwood. By and large, if most or all of a town’s territory is on a barrier island, or it fronts on the ocean in the part of Monmouth County where there are no barrier islands, then its home values are going to be higher than average, often significantly higher.
Many of these homes are not lived in year-round. All 51 of these shore towns have vacancy rates that are higher than the statewide rate by virtue of how we are defining “the Shore,” but the trend is toward a greater percentage of housing units being occupied only seasonally, whether as second homes or as summer rentals. (Homes that are not occupied in the off-season are counted as “vacant” by the Census Bureau, even if they are lived in for part of the year.) Among the 51 shore towns, the median housing vacancy percentage has crept steadily upward, from 41.2% in 2000 to 48.6% in 2010 to 54.0% in 2020. So as of 2020, more than half of these shore towns are more than half empty in the off-season, hinting at a decline in the number of year-round residents.
As the percentage of housing units occupied only seasonally has trended upward, year-round populations have in fact trended downward. The 51 shore towns as a group saw their number of year-round households decrease by 2.6% from 2010 to 2020, even as the number of households statewide increased by 3.0%. Among the 51 towns, more than two-thirds (36) experienced absolute decreases in the number of households, and an additional five increased at a slower rate than the state. Most of the 10 towns in which the number of households increased faster than the statewide rate are among those with mostly inland territory, where home values also tended to be lower and where population growth is most likely not taking place in the oceanfront areas.
Year-round Shore residents are increasingly likely to be retirees. In 2000, the median percent of residents age 65 or older among the 51 shore towns was 22.3%, increasing to 25.0% in 2010 and further to 31.8% in 2020. The percentage of people age 65+ statewide increased from 13.2% in 2000 to 13.5% in 2010 to 16.2% in 2020, as the huge Baby Boom demographic cohort has begun aging into retirement, but the increases have been more dramatic at the Shore. In 2020, 14 of the 51 shore towns had a 65+ percentage of 40% or more, up from only eight in 2010 and only one such town (Cape May Point) in 2000.
Rising residential values, an increasing share of housing units being occupied only seasonally, and the increasing presence of people age 65 and older among year-round residents all point to Shore towns becoming increasingly off-limits for year-round occupancy for all but wealthy retirees. This raises fundamental questions about the future of the Jersey Shore. Given the risks from sea-level rise and climate change more generally, who will be able to live at the Shore on a part-time or year-round basis? Should there be a stable or growing population at all? Will only wealthy people be able to afford to move there? And will these wealthy residents be required to rebuild with their own money the next time disaster strikes? These are all questions that state decision-makers should be considering, perhaps as part of a much-needed update to the State Development and Redevelopment Plan.
__________________
1We define the 51 “Jersey Shore towns” as municipalities along the Atlantic coastline (as opposed to the Raritan and Delaware bays) in Monmouth, Ocean, Atlantic, and Cape May counties in which at least 10% of housing units were tabulated as “vacant/seasonal” by the Census Bureau in 2010. (The Census Bureau did not distinguish seasonally vacant units in 2020.) The full list of Shore towns by county:
Monmouth County: Allenhurst, Avon-by-the-Sea, Belmar, Bradley Beach, Deal, Lake Como, Loch Arbour, Manasquan, Monmouth Beach, Sea Bright, Sea Girt, Spring Lake, Spring Lake Heights
Ocean County: Barnegat Light, Bay Head, Beach Haven, Eagleswood Township, Harvey Cedars, Island Heights, Lavallette, Little Egg Harbor Township, Long Beach Township, Mantoloking, Ocean Gate, Ocean Township, Point Pleasant Beach, Seaside Heights, Seaside Park, Ship Bottom, Stafford Township, Surf City, Toms River, Tuckerton
Atlantic County: Brigantine, Longport, Margate City, Ventnor City
Cape May County: Avalon, Cape May, Cape May Point, Lower Township, Middle Township, North Wildwood, Ocean City, Sea Isle City, Stone Harbor, Upper Township, West Cape May, West Wildwood, Wildwood, Wildwood Crest
2 To clarify, each of the 565 municipalities has an average residential value, and the median of those 565 averages is $337,227
Related Posts
 December 18, 2023 Sustainable Water Management: Program Rundown of Municipal Options
 July 18, 2023 The Changing Faces of New Jersey Developers
 June 6, 2023 Five Community Planning Initiatives To Solve Problems and Save Money
 September 22, 2022 New NJF Report Explores How to Promote Racial Integration in NJ Municipalities
 July 11, 2022 The Risk to Our Roofs: Considering and Harnessing the Climate-Housing Nexus
Tags: Economic, equity, flooding, Home Values, Housing, Housing Units, Housing Values, Hurricane Sandy, Jersey Shore, Populations, Shore, Superstorm Sandy


