New Jersey Future Blog
Are Millennials Leaving New Jersey Because Housing Costs Too Much?
April 22nd, 2019 by Tim Evans
What do the compact, walkable counties that attract New Jersey’s out-migrating Millennials – and the ones that don’t – tell us about why Millennials are leaving? Part 4 of a series investigating where New Jersey’s out-migrating Millennials are going.
New Jersey Future intern Alexandra Rome assembled the migration data on which this analysis is based.
- When Millennials leave New Jersey, they are usually looking for compact, walkable, transit-friendly places
- In particular, they are often looking for compact, walkable, transit-friendly places with lower housing costs than New Jersey’s
- New Jersey has a lot of compact, walkable, transit-friendly places, but perhaps most of them are too expensive for young adults to afford
 In parts 1, 2, and 3 of this series, we looked at the most common destinations, by county, for adults who move from New Jersey to other parts of the United States, and explored how the preferred destinations of Millennials differ from those of older out-migrants. The results were consistent with the documented preference for compact, walkable, mixed-use places expressed by the Millennial generation within New Jersey. In part 4, we look at the specific counties that are attracting a lot of New Jersey Millennials – and some of the ones that aren’t – and consider what these counties might tell us about what Millennials want that they aren’t finding in New Jersey. (Once again we restrict our analysis to migrants age 20 and older, using migration data by age from the 2010 and 2015 editions of the American Community Survey combined.)
Part 3 revealed that among all out-migrating adult New Jerseyans, those in the Millennial generation are more apt than older out-migrants to seek out places that are more urban, with higher density and higher rates of walking, biking, and public transportation use. This can be seen in more detail in Table 1, which shows the 70 counties that disproportionately attract Millennials from New Jersey – that is, where Millennials’ share of the county’s inflow from New Jersey exceeds 49.0 percent, which is Millennials’ share of all adult New Jersey out-migrants. (As in part 3, the analysis here is restricted to counties that received at least 100 adult migrants from New Jersey over the two years of data available.) The counties are sorted by the total number of Millennial in-migrants from New Jersey; blue shading indicates county population densities and rates of commuting via walking, biking, or public transit that exceed the comparable New Jersey statewide numbers — 1,224 people per square mile and 15.2 percent, respectively.
Popular destinations include:
- counties containing major urban centers up and down the rest of the Northeast Corridor: Boston, Providence, New Haven, New York City, Philadelphia, Wilmington, Baltimore, Washington, and Richmond;
- some of the more densely-populated suburban counties adjoining these urban centers, many of which contain their own smaller cities and older suburban downtowns and are served by regional public transit networks; examples include Middlesex, Norfolk, and Worcester counties around Boston; Montgomery and Delaware counties outside of Philadelphia; and Baltimore, Howard, Anne Arundel, and Prince George’s counties in Maryland, in the Baltimore-Washington corridor;
- core counties of some of the smaller metro areas elsewhere in the New England and Mid-Atlantic states, like the counties containing Buffalo, Rochester, Binghamton, and Poughkeepsie in New York and Scranton, Reading, York, and Harrisburg, Pennsylvania;
- smaller counties (mainly in the eastern third of the country) dominated by large academic/research institutions, such as the counties containing Ithaca, N.Y. (Cornell); State College, Pa. (Penn State); Durham, N.C. (Duke); Ann Arbor, Michigan (University of Michigan); Morgantown, W.V. (West Virginia University); and Burlington, Vt. (University of Vermont);
- core counties of a handful of major cities in the Midwest, South, and West, including the counties containing Cleveland and Columbus, Ohio; Chicago; Minneapolis; Norfolk, Va.; Nashville; Atlanta; Orlando; Denver; Seattle; Portland, Oregon; and Oakland, San Jose, and San Diego in California.
More than half of the popular Millennial destination counties (42 out of 70) have population densities that are higher than New Jersey’s, and 20 of them have rates of non-driving commuting that exceed New Jersey’s – an impressive feat, considering New Jersey has the second-highest rate of transit commuting in the nation after New York. New Jersey’s out-migrating Millennials, more so than are older out-migrants, are generally drawn to dense, walkable, transit-friendly counties. But as we also noted in part 3 of this series, New Jersey features plenty of such places of its own. What is prompting out-migrants to seek these characteristics in other states rather than in New Jersey?
Perhaps we can learn something about what the out-migrants don’t want by looking at counties that seem to fit the dense, walkable profile but are nonetheless not attracting New Jersey Millennials disproportionately – that is, either they attracted fewer than 100 adult migrants from New Jersey overall (and hence are not popular with New Jersey out-migrants in general, whether Millennial or otherwise), or the Millennial share of the county’s in-migrants from New Jersey is less than 49.0 percent (the Millennial share of all adult New Jersey out-migrants). Let us consider counties that did not make the list of popular Millennial destinations even though they satisfy the following two conditions:
- population density is 1,000 people per square mile or more, which is roughly the median density (1,034.6) of the 159 counties on the full list of counties that received at least 100 New Jersey out-migrants, and
- at least 8.7 percent of commuters (the national average) get to work by walking, biking, or public transit.
There are 22 such counties, listed in Table 2 below, sorted in descending order by the total number of Millennial in-migrants from New Jersey. Note that the counties near the top of the list are actually attracting substantial numbers of Millennials from New Jersey; it’s just that they are also attracting substantial numbers of older New Jerseyans too, meaning that they are not particularly attractive to Millennial migrants, in contrast to the counties in Table 1.
Since New Jersey Future has frequently posited that New Jersey’s high housing costs are a likely culprit behind the outflow of Millennials, the table also includes several variables that describe these costs (median home value, median rent, and the ratio of median home value to median household income, all from the 2016 five-year American Community Survey). Pink shading indicates values of these three housing-related variables that exceed the corresponding numbers for New Jersey (where median home value = $316,400, median rent = $1,213, and ratio of median home value to median household income = 4.29). The counties with non-driving commuting rates higher than New Jersey’s are shaded in blue, as in Table 1.
Note how many of these counties have housing-cost indicators that are higher than New Jersey’s statewide numbers: 14 of the 22 have median home values higher than New Jersey’s, 13 have higher median rents, and 17 have higher ratios of median home value to median household income. Thirteen of them exceed New Jersey’s numbers on all three metrics.
Several subgroups of counties suggest themselves, as far as their reasons for not disproportionately attracting New Jersey Millennials:
- Expensive suburbs of the big Northeast Corridor cities: Northern and central New Jersey essentially already consist of expensive suburbs of New York. For people who can afford them, why move from one expensive suburb to another one? Millennials who want to be close to the action in a big Northeastern city are generally headed for the city itself if they can afford it (otherwise they’ll stay in New Jersey and commute to New York for work or play). The expensive suburban counties near other Northeast Corridor cities are thus generally more popular with older migrants, who are more likely to be looking for the suburban lifestyle, than they are with Millennials. This group includes the New York City suburbs of Nassau, Westchester, and Rockland counties in New York, and Fairfield County, Connecticut; in the Washington D.C. area, the city of Alexandria and Arlington and Fairfax counties in Virginia, and Montgomery County, Maryland; and Essex County, Massachusetts, north of Boston.
- Big, relatively dense, but very expensive metro areas farther away: This group includes Honolulu County in Hawaii; Los Angeles County (the city of Los Angeles and its immediate suburbs); and San Francisco, San Mateo, and Contra Costa counties in the San Francisco Bay Area / Silicon Valley. (Note that Alameda County, home of Oakland, did make the list of Millennial magnets in Table 1, but only just – its Millennial percent of adult New Jersey in-migrants was 49.1 percent, barely above the 49.0 percent that Millennials comprise of all adult New Jersey out-migrants. It appears that most of the San Francisco area is expensive enough to deter New Jersey Millennial migrants almost entirely, but for the few who are willing to brave the high housing costs, Alameda County is the go-to choice.) These areas are nationally famous for their prohibitive housing costs; Millennials who are priced out of New Jersey are unlikely to find relief here. The counties containing Miami and New Orleans can arguably be put in this group as well, with at least one housing-cost metric exceeding the New Jersey value in both cases.
- Compact, walkable cities that seem like a good fit but perhaps can’t compete with closer options: There are several counties on this list that seem like they offer what Millennials are looking for but that nonetheless are not disproportionately enticing them away from New Jersey. This group includes the counties containing Pittsburgh, Milwaukee, St. Louis, and St. Paul. The values of all three housing-price indicators in these counties are lower than New Jersey’s, and the counties all have moderate to high density and relatively high rates of walking, biking, and public transit use. But perhaps St. Paul is overshadowed by neighboring (and bigger) Minneapolis, and Milwaukee is overshadowed by nearby (and bigger, although more expensive) Chicago or Lake County, Illinois (the northern Chicago suburbs, between Chicago and Milwaukee). As for Pittsburgh and St. Louis, they may not offer enough of a distinction from Philadelphia (which is also dense, transit-oriented, and cheaper than New Jersey, while being much closer) to warrant moving that far from home, though in that case it’s not clear why Millennials would be saying yes to Cleveland, Buffalo, and Rochester, which do appear (along with Minneapolis and Chicago) on the list of Millennial magnet counties in Table 1.
Note that in all but the last group, the counties’ high housing costs appear to be a deterrent to potential Millennial in-migrants. We can get a sense of the bigger picture by looking at summary data, where the effect of housing prices becomes clearer.
First, consider again the whole group of 159 counties that attracted at least 100 adult migrants (both Millennial and older) from New Jersey in 2010 and 2015 combined. In part 3, when these counties were separated into those that disproportionately attract Millennials and those that disproportionately attract older New Jerseyans, there was a clear pattern, in which the Millennial destination counties tended to be more densely populated and have higher rates of walking, biking, and transit commuting than the counties that primarily attract older migrants. Here, in contrast, when we look at median home value for this same group of 159 counties, there is no such pattern:
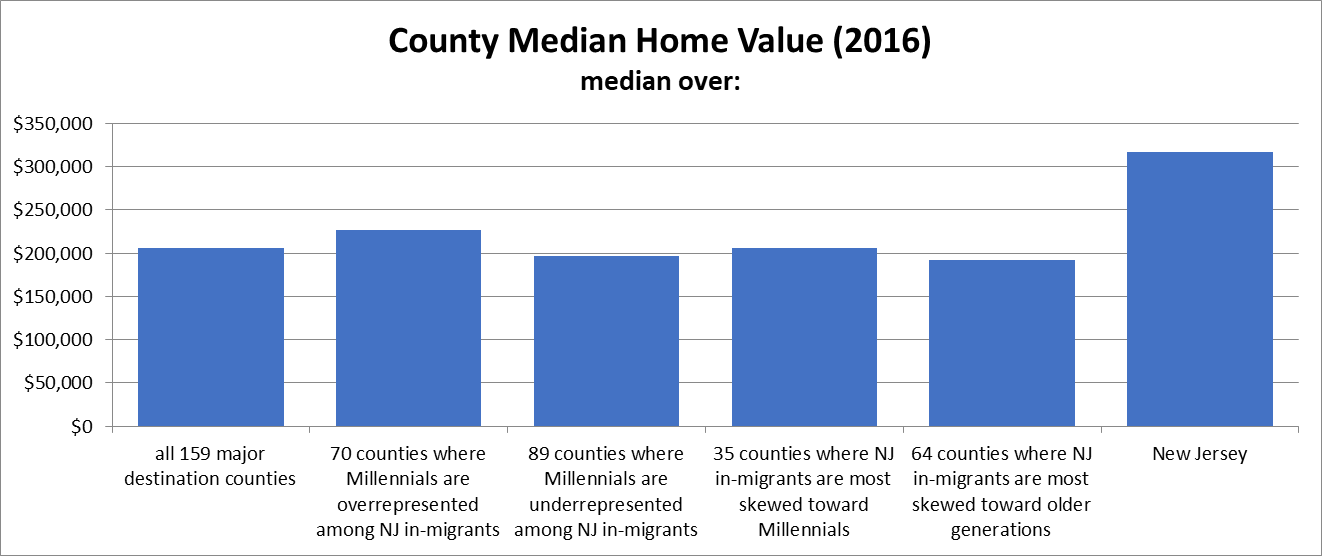
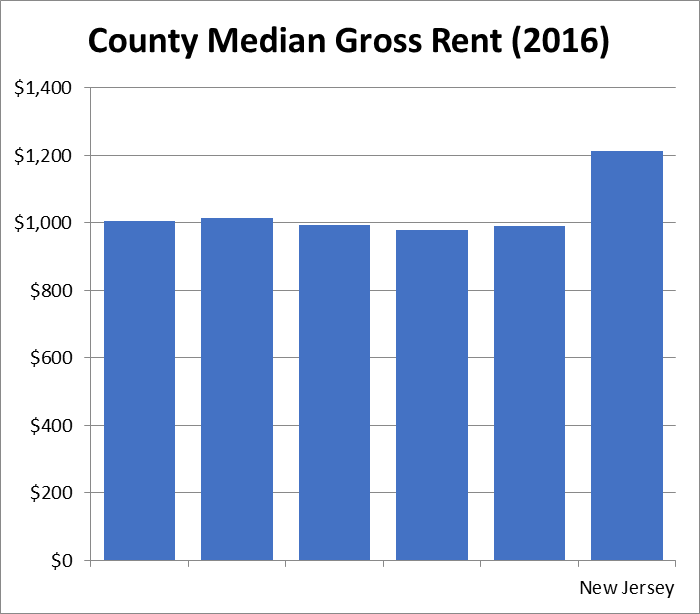
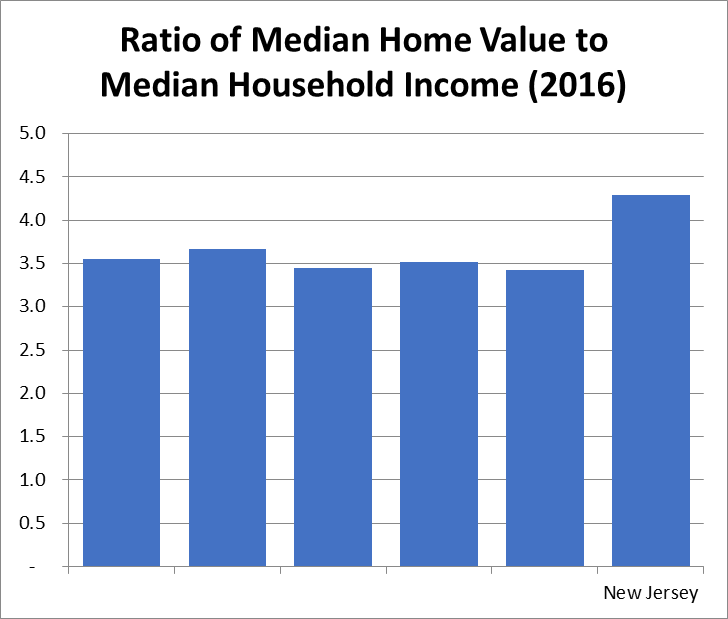
Instead, the only pattern that emerges is that both Millennials and older New Jersey out-migrants alike are generally moving to counties with lower home values than New Jersey’s. The results are slightly less dramatic but broadly similar for rents, where all five subgroups of destination counties have median values of median gross rent that hover around $1,000, compared to New Jersey’s $1,213, and for the ratio of median home value to median household income, where all five subgroups have median ratios clustered around 3.5, compared to New Jersey’s 4.3 (bars for county groups are shown in the same order as on the median home value chart, with labels removed for space considerations):
Now, let us compare housing-cost variables in the 70 counties that are the most favored by New Jersey’s Millennial out-migrants (the counties from Table 1) with the 22 counties with roughly similar development patterns but that are not acting as Millennial magnets (the counties from Table 2), and compare both groups to New Jersey. (Click on any graph for a larger image.)
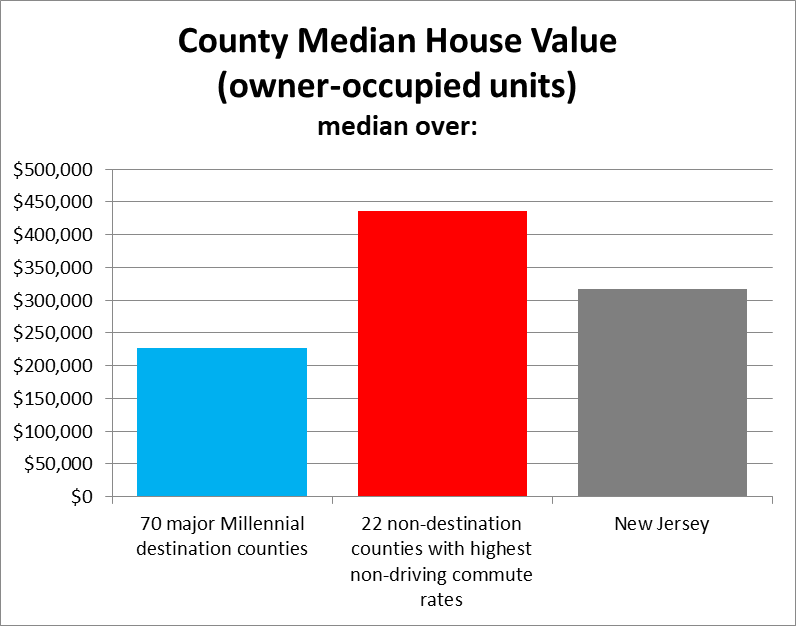
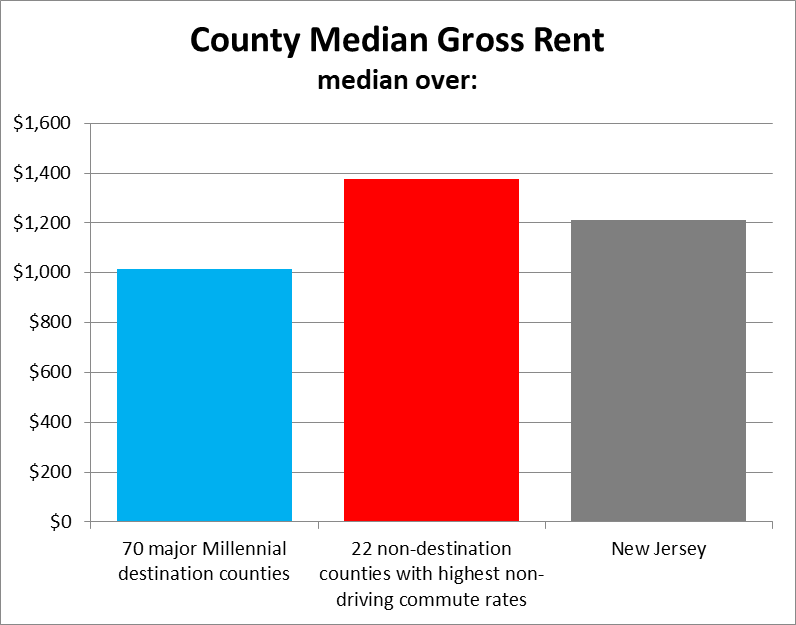
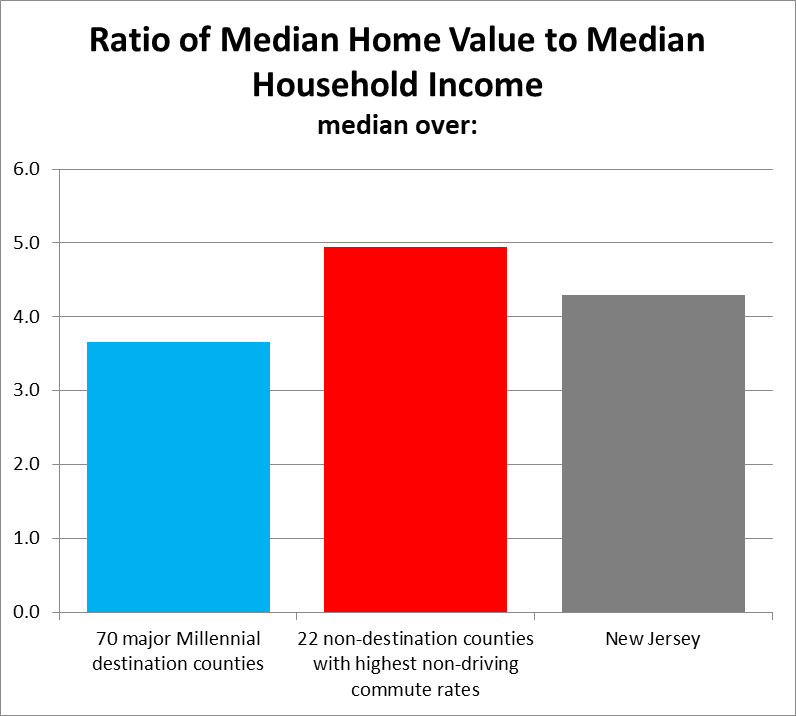
On all three metrics, the 70 Millennial-destination counties are typically less expensive than New Jersey, while the 22 non-destination counties are typically more expensive.
Keep in mind that the relationship is not iron-clad: There are certainly some expensive counties that appear on the list of popular Millennial destinations in Table 1, most notably the five boroughs of New York City, but also Washington, D.C., and the counties containing Boston, Seattle, San Diego, Oakland, and San Jose. Likewise, there are some less-expensive counties among the dense, walkable, transit-friendly non-magnets in Table 2 (the group that includes the counties containing Milwaukee and Pittsburgh). There are various, often qualitative rather than quantitative, arguments to be made as to why these counties act as exceptions to the broader trend.
But the broad trend is clear. When Millennials leave New Jersey, they are not just looking for compact, walkable, transit-friendly places; they are looking for such places that have lower housing costs than New Jersey’s (unlike their older fellow out-migrants, who are just looking for lower housing costs).
What does this say about how New Jersey might be able to retain (or win back) more of its Millennials? A seemingly obvious solution would be to try to bring housing prices down by adding more supply. But not just any supply, and not just anywhere. New Jersey needs to start producing more housing of the sizes and types that Millennials want (i.e. not big single-family homes), in the compact, walkable, transit-friendly cities and traditional suburban downtowns where they can achieve the live-work-shop-play balance they are looking for.
Related Posts
 February 26, 2019 What Kinds of Places Are Attracting New Jersey’s Out-migrating Millennials?
- November 7, 2018 Where Do New Jersey’s Out-Migrating Millennials Go?
- October 25, 2018 Where Do New Jersey’s Out-Migrants Go?
 September 12, 2018 Yes, Millennials Really Are Fleeing the State. The Data Say So.
 September 28, 2017 Analysis: New Jersey Is Losing Its Millennials


