New Jersey Future Blog
Population Trends at the Jersey Shore, Part 1: Long-Term
October 17th, 2016 by Tim Evans
Prompted by an article in June about how the Jersey Shore was losing population (specifically, losing year-round residents), New Jersey Future intern Sarah Koenig spent some time delving into the Census Bureau’s municipal population, housing, and income numbers, to see if the data could yield some insight into what might be the driving forces behind the population loss.
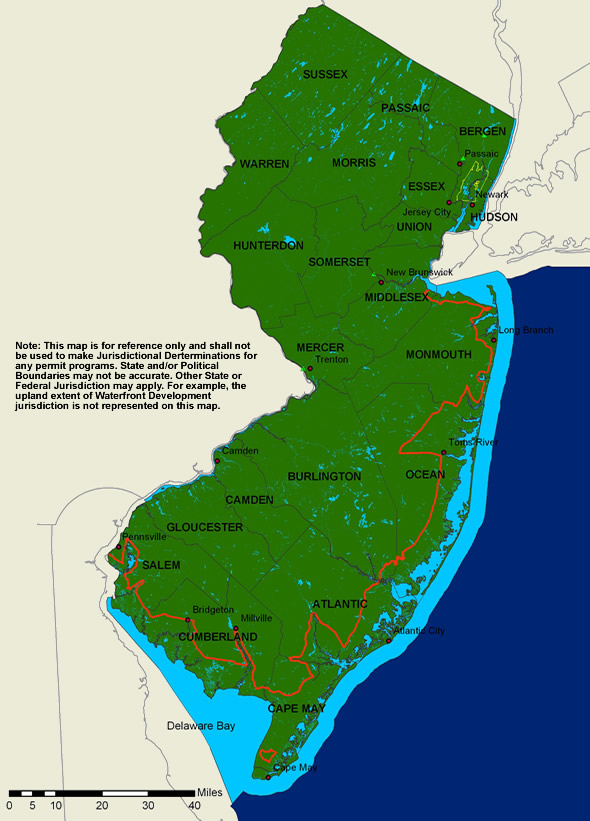
Area under CAFRA jurisdiction is outlined in red. Click on image for larger version.
The findings reported here focus on the period beginning in 2000, since that is when the declines in year-round population began and also when the other changes in the data began appearing. Part 2 of the findings, to be released in two weeks, will concentrate specifically on the post-Hurricane Sandy period from 2012 to 2014.
For purposes of this analysis, we included all municipalities that fall wholly or partially within the jurisdiction of the Coastal Area Facilities Review Act (CAFRA; see map). We then divided them into three subgroups, which we analyzed separately: 1) Atlantic oceanfront; 2) bays and other coastal areas; and 3) non-coastal but tidal riverine areas. (More detail about the methodology is at the end of this article.)
It is the Atlantic oceanfront subgroup that contains the places most commonly evoked by the term “Jersey Shore,” places where the real estate market is dominated by people’s desire to be near the ocean in the summer, and it is in this group where growth patterns diverged most notably from statewide trends in the long-term analysis:
-

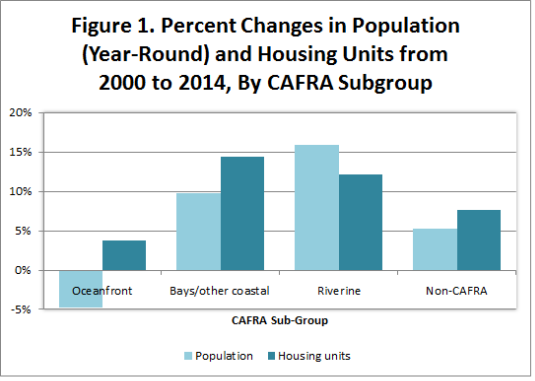
Despite loss of year-round population since 2000, the number of housing units in the Atlantic oceanfront municipalities continued to grow.
Population decreases began in 2000. Between 1990 and 2000, Atlantic oceanfront municipalities as a group experienced a 9.40 percent increase in population, but between 2000 and 2012 there was a 4.67 percent decrease, followed by another 0.10 percent decrease between 2012 and 2014. So the post-Sandy losses were merely the continuation of a trajectory that was already in place since 2000. The losses are also specific to the Atlantic oceanfront subgroup; the other CAFRA subgroups and the rest of the state continued to gain population over the entire period from 2000 to 2014. (See Figure 1.)
- Population decreases were widespread. Population losses between 2000 and 2014 were widespread across the Atlantic oceanfront CAFRA subgroup. Of the 46 municipalities we assigned to this group, 41 of them (89 percent) had fewer year-round residents in 2014 than in 2000.
- The number of housing units increased. Despite the population loss, the total number of housing units in the Atlantic oceanfront CAFRA subgroup continued to grow modestly, increasing by 4.0 percent from 2000 to 2012, but followed by a small decrease post-Sandy. (See Figure 1.)
-
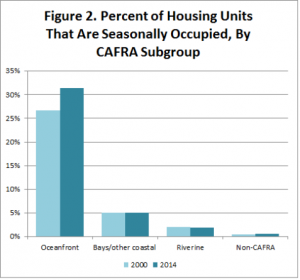
The percent of the housing stock that is only seasonally occupied increased dramatically in Atlantic oceanfront municipalities between 2000 and 2014.
The percentage of housing units used seasonally increased. The percent of housing units that are used seasonally (i.e., summer vacation properties) along the Atlantic oceanfront has increased dramatically since 2000, from 26.7 percent of the total housing stock in 2000 to 31.4 percent in 2014. The percent of seasonally vacant units in the other CAFRA subgroups remained mostly unchanged, although there was a slight increase post-Sandy in the “other coastal” subgroup. (See Figure 2.)
- The percentage of newer housing units is higher. The percentage of housing units that were built since 2000 is higher in the Atlantic oceanfront subgroup than in the state’s non-coastal municipalities – 11.1 percent vs. 9.6 percent. This has happened despite the Atlantic oceanfront municipalities being mostly built out: The median build-out percentage (the percent of developable land that has already been developed) across the 46 municipalities in the Atlantic oceanfront subgroup was 98.0 percent as of 2007. (The state as a whole was 60.7 percent built-out in 2007.) It is difficult to add that many new housing units in so intensively developed an area without tearing down old ones.
-
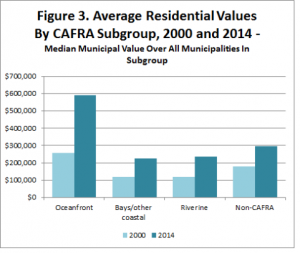
Home values are higher in Atlantic oceanfront municipalities, and have been rising faster, than in other coastal areas or in the rest of the state.
Residential values are higher, and rising faster. As may be expected for a resort area, average residential values (including all properties, whether year-round or seasonal) are much higher in the Atlantic oceanfront municipalities and have been increasing faster. Data on average residential value are available at the municipal level, and a look at the medians of these municipal average values over all municipalities in each group provides an idea of how the groups compare. In 2000, the median municipality in the Atlantic oceanfront subgroup already had an average residential value that was 44 percent higher than the average value in the median non-coastal municipality. And the Atlantic oceanfront subgroup has only widened the gap with the rest of the state since then: As of 2014, the median Atlantic oceanfront municipality now has an average residential value of $589,650, double the average value of $295,167 in the median non-coastal municipality. Residential properties were already more expensive in the Atlantic oceanfront municipalities than elsewhere in 2000, and they have gotten more expensive more quickly since then. (See Figure 3.)
- Rising values are not due to increasing size. While average residential values are higher and have risen faster in the Atlantic oceanfront CAFRA subgroup than elsewhere, this does not appear to be because housing units at the Shore are particularly large compared to elsewhere. In the median Atlantic oceanfront municipality in 2000, the percent of housing units having nine or more rooms was 9.5 percent, compared to 11.0 percent in the median non-coastal municipality the same year. As of 2014, the percent of nine-or-more-room housing units in the median Atlantic oceanfront municipality had risen to 10.9 percent – a 1.4 percentage point increase – while in the median non-coastal municipality it was up to 14.9 percent, an increase of 3.9 percentage points. In the other two CAFRA subgroups, the median municipalities in terms of percent of units having nine or more rooms lagged both the non-coastal municipalities and the Atlantic oceanfront subgroup in 2000, but by 2014 had pulled even with the Atlantic oceanfront. So large homes have been growing more slowly as a percent of the total housing stock in the Atlantic oceanfront municipalities than they have anywhere else. It does not appear to be the size of the units that is responsible for the increase in home values at the Shore.


The fact that the decline in year-round population in the Atlantic oceanfront CAFRA subgroup since 2000 coincides with a relatively modest increase in the total number of housing units, along with a more dramatic increase in the percent of housing units that are seasonally vacant, suggests that year-round residence is being replaced by seasonal occupancy in many places. And the percent of units built since 2000 at the Shore being higher than the statewide percent, despite these places being mostly built-out, points toward this replacement taking place via demolition of old housing units and construction of new ones. The newer housing units are not necessarily bigger, since the percent of the housing stock having nine or more rooms has not increased notably. But the housing stock at the Shore in general has gotten more expensive, whether because the newly-constructed seasonal units are bringing up the average or because the existing stock is appreciating, or both.
A word on methodology: Our first pass at defining “the Shore” was to include all municipalities that fall wholly or partially within CAFRA’s jurisdiction. Then, in recognition that a purely hydrological definition of the Shore would likely miss important cultural and real-estate distinctions among different types of coastal communities, each CAFRA municipality was further classified into one of three locational groups, based on which body of water it primarily borders: 1) Atlantic oceanfront; 2) bays and other coastal areas; and 3) non-coastal but tidal riverine areas. Analyses of changes in population, housing, and income from 1990 through 2014 and for several subintervals therein were done for each of these CAFRA subgroups and then compared to statewide patterns. We found that two of the three subgroups – bays/other coastal areas and tidal riverine areas – largely either mirrored the rest of the state or differed from statewide trends in ways that can best be explained by these municipalities generally being located in faster-growing parts of the state (like inland Ocean and Atlantic counties). These places tend to be year-round communities that happen to front at least partially on a tidal body of water rather than true “Shore” resort communities.
Related Posts
 September 14, 2016 Explainer: How to Think About New Jersey’s Population (and Income) Growth
 March 17, 2016 New Jersey’s Population Is Still Growing
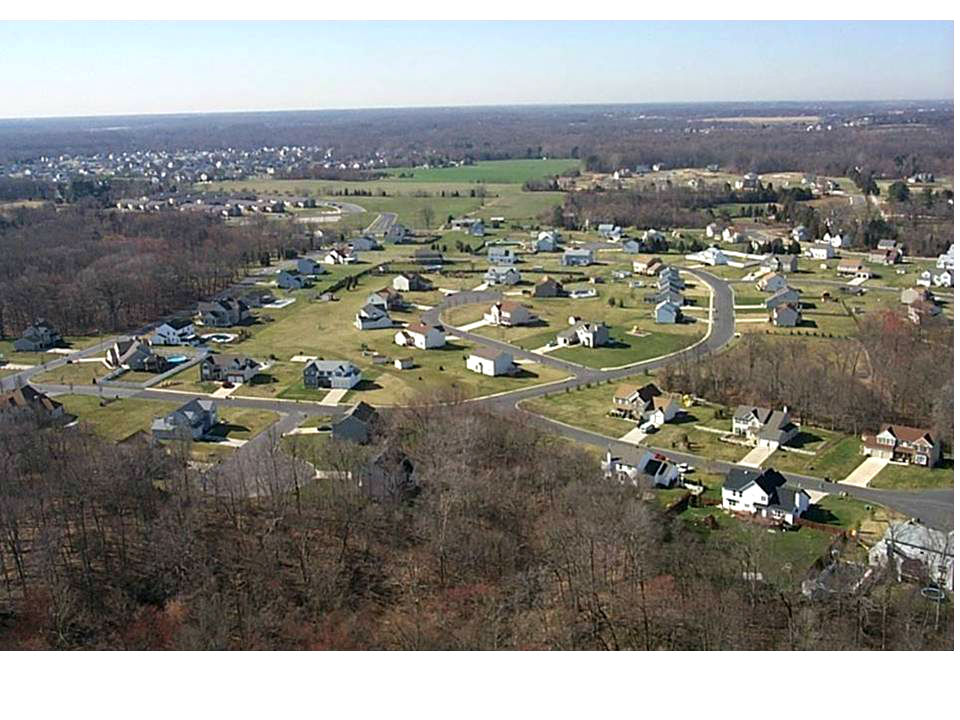 April 4, 2014 New County Population Estimates: Older Places Continue Their Revival
 June 12, 2012 New Jersey Counties Show Dramatic Reversal in Population Growth Patterns
 December 1, 2011 Census Data Show Population Growth Has Slowed Across New Jersey


